Outside of energy commodities, capital markets posted a downbeat March as cross-asset volatility spiked in response to the outbreak of hostilities in the Mideast, and kicked off April in similar, choppy fashion before posting a swift bounce following last Wednesday’s two-week ceasefire agreement. While a positive breakthrough, it may still be a little too early to sound the ‘all clear’ as the flow of oil through the Strait of Hormuz remains constrained. Don’t forget, behind today’s headlines, the economy is still dealing with negative trade and immigration shocks and a positive artificial intelligence (AI) shock.
As we discussed in the latest Economic Navigator, whether volatility becomes lasting is ultimately an economic question. Persistent market stress tends to follow when risks transmit into the real economy through slower growth, shifting inflation dynamics, weakening labor markets, or tighter financing conditions. If volatility remains contained — without a sustained tightening in financial conditions or a measurable deterioration in economic indicators — the macro impact is usually limited. The focus, therefore, should be on monitoring the transmission mechanism from risk to economic activity, not the catalyst itself.
Talking Points to Set Context
On inflation:
- Headline inflation rose 0.9%, with roughly 80% of the increase directly attributable to energy, and an even larger share when the spike in airfares is included. Core services inflation excluding housing increased just 0.18%, the lowest monthly gain in nearly a year. The underlying trajectory here remains constructive and should not be overlooked.
- Second‑order effects from the energy shock are beginning to show up in transportation, which carries roughly a 16% weight in the CPI basket.
- Medical care and used vehicle prices both declined in March. However, we will need a sustained moderation in healthcare inflation before becoming confident that overall inflation will converge to the Federal Reserve’s (Fed) target by next year.
- With the Hormuz chokepoint closed for an extended period, one or two additional firm inflation prints are likely in the near term, driven primarily by transportation services and selected durable‑goods categories. These second‑round effects could add roughly 0.2 percentage points to inflation over the next few months. Against this backdrop, the Fed is clearly on hold for the next several policy meetings.
On Growth:
- Q1 economic growth is likely to undershoot consensus. Real consumer spending will not contribute as meaningfully to growth as it has in prior quarters. Real spending was flat in January and rose just 0.1% in February. That said, solid business investment and an increase in government spending should keep Q1 GDP near 2%.
- Initial unemployment claims remain low, suggesting the labor market is holding steady despite slowing growth. Expect average monthly payroll gains to hover around 50,000 this year. That resilience gives the Fed time to remain patient as it balances its dual mandate. Given the broader macro backdrop, we do not expect rate hikes this year but as conditions weaken, the next Fed action will likely be a cut.
- Earlier survey data show purchasing managers reporting stronger new orders, driven by demand for digital transformation, increased reliance on cloud‑based solutions, and rising demand for software platforms. As a result, business investment should be a meaningful contributor to Q1 GDP growth.
- Corporate profits rose $246.9 billion in Q4, accelerating from a $175.6 billion increase in Q3. Profit growth was particularly strong in durable goods manufacturing, a notable outcome given the presence of tariffs and ongoing geopolitical uncertainty.
Bottom line: Economic growth was already moderating before the eruption of conflict in the Middle East. Offsetting that weakness are a stable labor market, solid corporate profit growth, and continued strength in technology‑related investment, which should allow a subset of the corporate sector to support the broader economy amid elevated geopolitical uncertainty.
Using Global Financial Conditions for Guidance
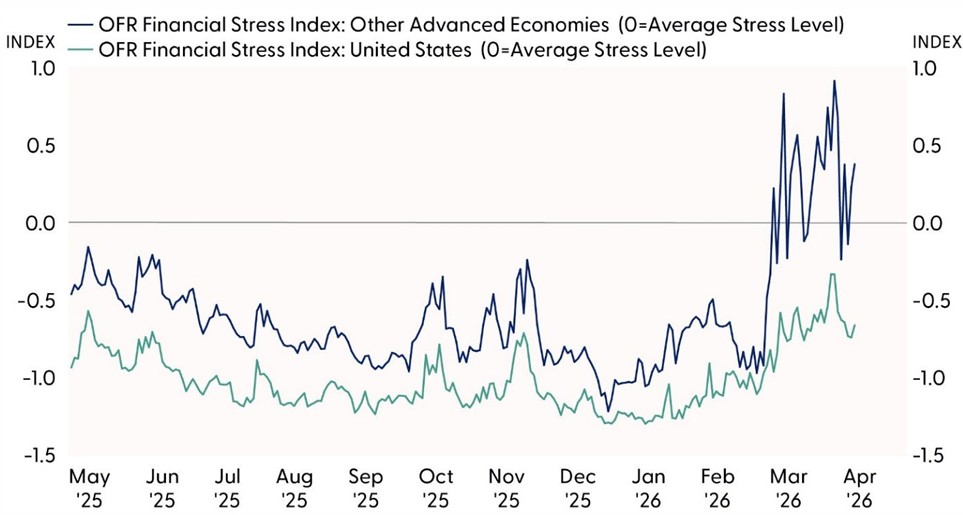
Credit spreads and funding conditions are highly valuable for tracking stress in banking and for assessing any damage from geopolitical risks. Credit spreads represent the difference in borrowing costs for firms of different creditworthiness, and in times of stress, credit spreads may widen when default risk increases or credit market functioning is disrupted. Wider spreads may indicate that investors are less willing to hold debt, increasing costs for borrowers to get funding. Tying the previous concept with this, financial stress was not as high during the Russian invasion of Ukraine as the stress induced by fundamental economic factors like high inflation and tighter monetary policy. Bringing it into today’s global energy shock, credit indicators remain below average stress levels in the U.S. but are above average in advanced economies. Funding indicators, which measure how easily financial institutions can fund their activities, have tightened in recent days. In times of stress, funding markets can freeze if participants perceive greater counterparty credit risk or liquidity risk. Rising stress in funding will be important to monitor.
International Funding Conditions Have Deteriorated More Than U.S.
Source: LPL Research, Department of Treasury 04/09/26
Disclosures: Indexes are unmanaged and cannot be invested in directly. Past performance is no guarantee of future results.
As the creators of the Geopolitical Risk (GPR) index explain, higher geopolitical risk foreshadows lower investment, stock prices, and employment. Higher geopolitical risk is also associated with higher probability of economic disasters and with larger downside risks to the global economy. But will conditions improve like they did in 2022? Guidance comes from these daily updates from the Office of Financial Research (OFR), an independent bureau reporting to the Department of Treasury.
The OFR Financial Stress Index (OFR FSI) is a daily market-based snapshot of stress in global financial markets and is highlighted above. It is constructed from 33 financial market variables, including yield spreads, valuation measures, and interest rates. The OFR FSI is positive when stress levels are above average, and negative when stress levels are below average. For now, U.S. conditions remain below average stress levels, but bank funding risks are rising.
Track Dollar Performance for Clues
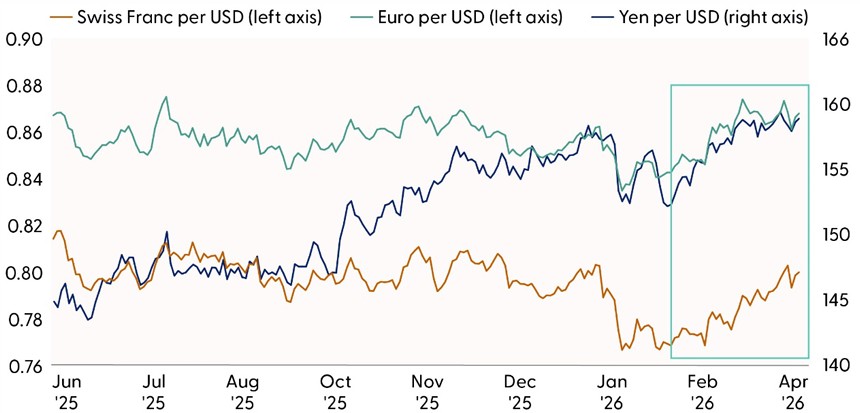
The recent appreciation of the U.S. dollar (USD) against most currencies reflects investors’ assessment that the U.S. economy offers a uniquely strong combination of relative growth resilience, higher returns, and financial-system credibility. Compared with other advanced economies, the U.S. continues to exhibit firmer growth, a more flexible labor market, and a Fed committed to price stability. At the same time, global uncertainty has reinforced demand for deep and liquid dollar-denominated assets, which remain a key source of safe and scalable collateral. As capital flows toward the U.S. for both return and safety — and away from lower-growth, lower-yield, or policy-constrained economies — the dollar strengthens broadly, signaling that global investors continue to rank the U.S. economy as a relative safe haven.
There are some historical examples that explain why we have dollar appreciation against most currencies during times of global stress. Like the 1990s, the U.S. economy has stronger relative growth and productivity than other major trading partners. The U.S. growth trajectory, for example, is stronger than in Europe and Japan. Stronger corporate profitability and higher returns on invested capital legitimize safe-haven flows.
Further, like the post-Great Financial Crisis (GFC) era, the dollar remains highly liquid. The dollar is still the primary trade invoicing unit, foreign exchange (FX) hedging benchmark, and global collateral asset. Dollar strength tightens non-U.S. financial conditions disproportionately.
U.S. Dollar Gained As Safe Haven Status Persists
Source: LPL Research, Federal Reserve Board 04/09/26
Disclosure: Past performance is no guarantee of future results.
Signs of a Regime Shift
If a dollar regime shift has started, you will observe at least these four signals. First, the USD weakens against both high-beta and safe-haven currencies. Second, U.S. yields rise without FX support. Third, foreign assets outperform in local currency and USD terms. Fourth, volatility rises without a flight into the dollar. Some events may give a false signal. Fed easing cycles could weaken the dollar but may not be sufficient for a real regime shift.
Given the current path of future easing, let’s end with a few counterintuitive examples of dollar strength amid lower fed funds.
U.S. rate cuts have supported the dollar at several points in history — not because lower rates are dollar-positive mechanically, but because the cuts improved the U.S. outlook relative to the rest of the world or stabilized global risk. Context is key. Here are the cleanest examples.
First, is the 1998 Asian and Russian crisis along with Long Term Capital Management (LTCM). The Fed cut rates three times in late 1998 to contain global financial stress. The cuts stabilized U.S. growth while much of Asia and parts of Europe were in crisis. Global investors increased exposure to U.S. assets as the safest large market. The dollar strengthened despite easier policy, especially versus emerging markets (EM), and the euro’s predecessors.
The second period was the post-dotcom recession in 2001–2002. The Fed aggressively cut rates after the tech bust, and these cuts helped limit the depth of the U.S. downturn. Capital continued to flow into U.S. treasury markets because alternatives were weaker, especially mid-2001. The dollar stayed strong initially and only weakened later once global growth recovered.
A third period was during the early phases of the GFC in 2008. In the initial stage of the GFC, the Fed began cutting rates before other central banks. Markets interpreted the cuts as crisis containment, not policy weakness. The dollar rose sharply during late 2008 and 2009, even as rates fell.
However, cuts tend to weaken the dollar when they signal a sustained disinflation or growth slowdown, a fiscal or institutional breakdown, or a permanent deterioration in U.S. returns relative to the rest of the world.
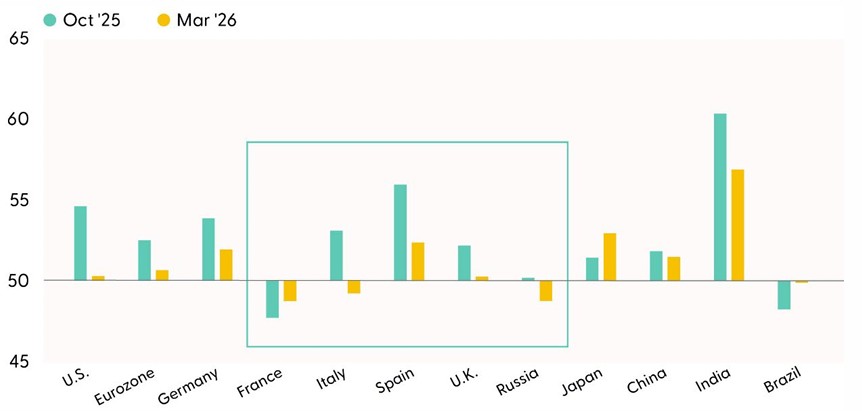
Many Composite PMIs Expanded Despite Ongoing Middle East Conflict
Source: LPL Research, Standard and Poor’s 04/09/26
Disclosures: Past performance is no guarantee of future results.
Purchasing Manager Indexes (PMIs) for several important global economies are holding steady in the face of an energy supply crisis. For March, many country PMIs were above 50, implying business expansion. If the Middle East crisis is resolved by the end of April, the global economy will most likely skirt recession. The countries most tenuous are those with weaker fundamentals, such as France, Italy, Russia, and Brazil.
Conclusion
A spike in geopolitical risk often foreshadows lower investment, stock prices, and employment. When funding costs or credit availability change, economic effects follow. For now, the risks to growth are to the downside as credit conditions tighten. Shipments of non-defense capital goods excluding aircraft suggest business investment will support Q1 gross domestic product (GDP). Real disposable personal income has supported the consumer so far this year, so we expect Q1 GDP will likely reach 2.1% annualized. The Middle East impacts could be more pronounced in Q2 and Q3 as second-order effects take hold. Nevertheless, we still expect the remaining quarters to hover around 2% on average.
Inflation is the greater risk. If supply chain pressures remain in place, the annual pace of inflation could temporarily rebound to a high of 3.5% year over year, as measured by the headline price index from Personal Consumption Expenditures (PCE). However, if the Middle East conflict simmers and energy supply chains improve, we should expect inflation to moderate in the latter half of this year.
The key question is how geopolitical risks are transmitted into the economy (via trade, energy, confidence, policy, financial conditions), rather than reacting to the risks themselves. Volatility matters only if it changes behavior, cash flows, or policy paths.
Asset Allocation Insights
LPL’s Strategic Tactical Asset Allocation Committee (STAAC) maintains its tactical neutral stance on equities. Without a permanent offramp in Iran and given oil prices remain elevated, investors may be well served by bracing for additional volatility. The stock market’s resilient track record during geopolitical crises is reassuring, leaving STAAC to look for opportunities to potentially add equities at lower levels rather than remove equities due to what will likely be short-term market disruption. Technically, the broad market’s long-term uptrend remains intact.
STAAC’s regional preferences across the U.S., developed international, and emerging markets (EM) are aligned with benchmarks. Attractive valuations in non-U.S. equities are offset by upward pressure in the U.S. dollar, although the Committee continues to watch EM closely for opportunities due to improvements in fundamentals and the technical analysis picture pre-Iran conflict.
The Committee still maintains a slight preference for growth over value tilt and large caps over small caps. In terms of domestic sectors, communication services remains an overweight, while the Committee continues to debate making a purchase of its shopping list, which includes healthcare, industrials, and technology.
Within fixed income, the STAAC holds a neutral weight in core bonds, with a slight preference for mortgage-backed securities (MBS) over investment-grade corporates. The Committee believes the risk-reward for core bond sectors (U.S. Treasury, agency MBS, investment-grade corporates) is more attractive than plus sectors. The Committee does not believe adding duration (interest rate sensitivity) at current levels is attractive and remains neutral relative to benchmarks.
Important Disclosures
This material is for general information only and is not intended to provide specific advice or recommendations for any individual. There is no assurance that the views or strategies discussed are suitable for all investors or will yield positive outcomes. Investing involves risks including possible loss of principal. Any economic forecasts set forth may not develop as predicted and are subject to change.
References to markets, asset classes, and sectors are generally regarding the corresponding market index. Indexes are unmanaged statistical composites and cannot be invested into directly. Index performance is not indicative of the performance of any investment and do not reflect fees, expenses, or sales charges. All performance referenced is historical and is no guarantee of future results.
Any company names noted herein are for educational purposes only and not an indication of trading intent or a solicitation of their products or services. LPL Financial doesn’t provide research on individual equities.
All information is believed to be from reliable sources; however, LPL Financial makes no representation as to its completeness or accuracy.
All investing involves risk, including possible loss of principal.
US Treasuries may be considered “safe haven” investments but do carry some degree of risk including interest rate, credit, and market risk. Bonds are subject to market and interest rate risk if sold prior to maturity. Bond values will decline as interest rates rise and bonds are subject to availability and change in price.
The Standard & Poor’s 500 Index (S&P500) is a capitalization-weighted index of 500 stocks designed to measure performance of the broad domestic economy through changes in the aggregate market value of 500 stocks representing all major industries.
The PE ratio (price-to-earnings ratio) is a measure of the price paid for a share relative to the annual net income or profit earned by the firm per share. It is a financial ratio used for valuation: a higher PE ratio means that investors are paying more for each unit of net income, so the stock is more expensive compared to one with lower PE ratio.
Earnings per share (EPS) is the portion of a company’s profit allocated to each outstanding share of common stock. EPS serves as an indicator of a company’s profitability. Earnings per share is generally considered to be the single most important variable in determining a share’s price. It is also a major component used to calculate the price-to-earnings valuation ratio.
All index data from FactSet or Bloomberg.
This research material has been prepared by LPL Financial LLC.
Not Insured by FDIC/NCUA or Any Other Government Agency | Not Bank/Credit Union Guaranteed | Not Bank/Credit Union Deposits or Obligations | May Lose Value
For public use.
Member FINRA/SIPC.
RES-0006894-0326 Tracking #1091677 | #1091678 (Exp. 04/27)