
Has AI Become a Rates Story?
November 02, 2026 | LPL Research
Financing the AI buildout: Bonds have been behind the world’s biggest buildouts, effectively financing the future throughout history. And while equity markets have remained front and center amid the ongoing artificial intelligence (AI) driven bull market, as hyperscaler capital expenditures (capex) close in on $1 trillion per year, what was mostly an equity market story may now be turning into a rates market story as well.
Rising bond issuance: Hyperscalers have routinely begun selling longer-maturity bonds, and smaller borrowers have also entered the mix. With capex guidance continuing to grow, the supply wave is likely far from over, and markets have broadly absorbed this issuance well.
Implications for rates and credit: But at a price. Here, we’ll discuss the impacts of the AI buildout on both the Treasury and credit markets, and what this could mean for investors.
AI’s Buildout, Bonds’ Burden
In his new book, A Fabulous Debt, the Financial Times’s Robin Wigglesworth traces how the bond market quietly built the modern world. He follows it from the water boards that financed Holland’s dikes, through the bonds behind Alexander Hamilton’s vision for a young America, to the trillion-dollar portfolios of today. One thread runs through that history: when a society decides to build something enormous, it borrows to do it, and the bond market ends up shaping the cost of money for everyone else.
The AI buildout is the newest chapter in that story, and it is being written in real time. The largest technology companies in the world, long celebrated for funding themselves from cash flow, are now selling, among other tenors, 30- and 40-year bonds to pay for data centers, chips, and power. They are doing so at a pace that is pushing up Federal Reserve (Fed) rate expectations, competing with the U.S. Treasury for long-duration buyers, and repricing the corporate bond market. Bonds have financed humanity’s great construction projects for centuries. This one is happening on our watch, and in our view, the AI buildout has become one of the most important domestic drivers of U.S. interest rates.
And right now, this buildout is working against bondholders on two fronts at once. It is keeping growth and inflation hot enough that the Fed is hiking again, and it is flooding the long end of the bond market with corporate duration that competes with Treasuries for the same buyers. Our view is simple: the market is pricing a buildout that keeps accelerating, so any pause or slowdown is the most underappreciated upside catalyst for Treasuries heading into 2027.
The Buildout is a Macro Variable, Not a Sector Story
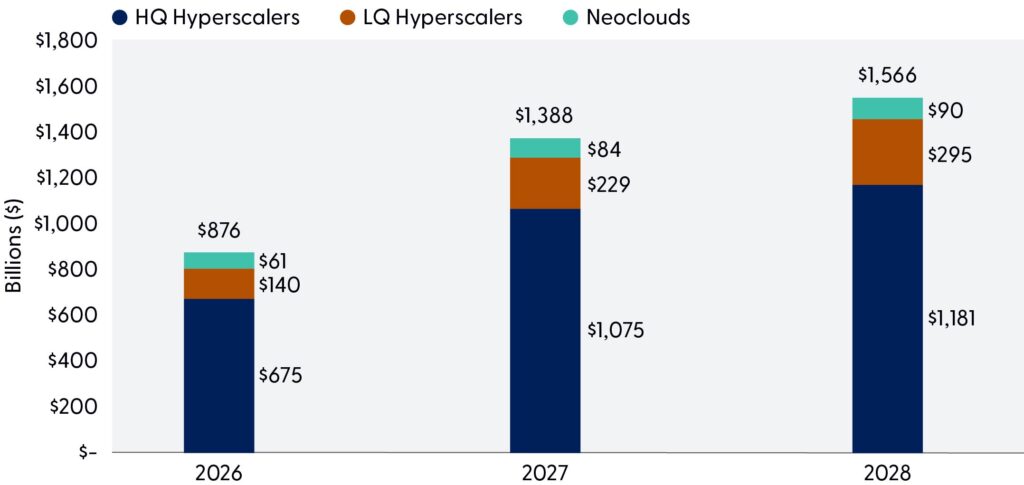
The scale alone makes AI a macroeconomic force. The four largest hyperscalers are guiding to roughly $730 billion of capital spending in 2026, up about 78% from roughly $410 billion in 2025. Even if capex growth slows to roughly 37% in 2027, less than half of this year’s pace, total spending would still reach $1 trillion. The spending is now large enough to move the whole economy. AI capex is now a major swing factor in U.S. growth, a piece of demand that keeps the economy running hot even as housing and lower-income consumers feel the squeeze of higher rates.
While high-quality (HQ) hyperscalers remain the dominant driver of capex spend, lower-quality (LQ) hyperscalers and neoclouds are expected to ramp up their spend as well, mostly financed in the bond markets. The distinction is important as the market is currently treating each segment differently with LQ and neocloud companies most prone to elevated volatility.
HQ hyperscalers are the largest cloud and platform companies, rated in the AA category or higher. They generate enough operating cash flow to fund most of their capex. Their bonds trade as a supply story rather than a credit story.
LQ hyperscalers are companies building data center capacity on a hyperscale level but with balance sheets that cannot fund it internally. They are typically rated in the BBB range, with capex that exceeds operating cash flow.
Neoclouds are specialized cloud providers built specifically to rent AI computing capacity, mainly GPUs, to model developers and other tech companies. Typically high yield rated or unrated, they are the most direct credit exposure to the buildout and the first place stress would appear if it slows.
Capex Expectations Continue to Climb
Source: LPL Research, Bloomberg 10/26/26
Disclosure: Indexes are unmanaged and cannot be invested in directly. Past performance is no guarantee of future results.
The takeaway for bond investors: strip out AI and the U.S. capex cycle looks like it is contracting under the weight of 5% long rates. Leave it in and the economy looks strong enough to justify more Fed hikes. That is why the Fed, and the bond market are so sensitive to every AI guidance update.
As well, capex has outrun cash flow, so the buildout is now being financed in the bond market. Alphabet reported its first-ever negative quarterly free cash flow after $44.9 billion of Q2 capex, and Meta’s Q2 capex consumed about 98% of its operating cash flow. When the most cash-rich companies in the world turn into net borrowers, the buildout stops being a stock market story and becomes a rates story.
Channel One: AI is Lifting the Front End Through the Fed
The most direct way the buildout pushes yields higher is through the Fed’s reaction function. On September 16, the Federal Open Market Committee (FOMC) raised rates by 25 basis points to 3.75% to 4.00%, its first hike since July 2023. While the Fed fulfilled expectations of a hold last week, the markets are priced for, and the median dot implies, one more hike this year.
The September minutes, released on October 7, were explicit that AI is part of the inflation problem, with participants saying surging AI-related investment, alongside higher oil and fuel prices, was contributing to inflation pressure. And the price data backs this up. Electricity CPI rose about 4.4% year-over-year through September, outpacing headline inflation.
Two inflation channels deserve a closer look, because they behave differently:
- Chips are a fast channel. AI data centers are absorbing so much memory and storage capacity that consumer electronics have gone from a reliable source of deflation to a source of inflation. This channel can reverse quickly if chip demand cools.
- Power is a slow channel. What is less widely appreciated is the lagged inflation impulse coming from the power and construction bottlenecks. Data centers are competing with housing, infrastructure, and reshoring for constrained grid capacity, skilled labor, transformers, and materials. Those constraints could keep inflation and longer-term rate premiums elevated even if AI optimism fades.
This mix matters for our outlook: the fast channel gives the Fed reason to keep hiking now, while the slow channel means some AI-related inflation will outlast any pause in spending.
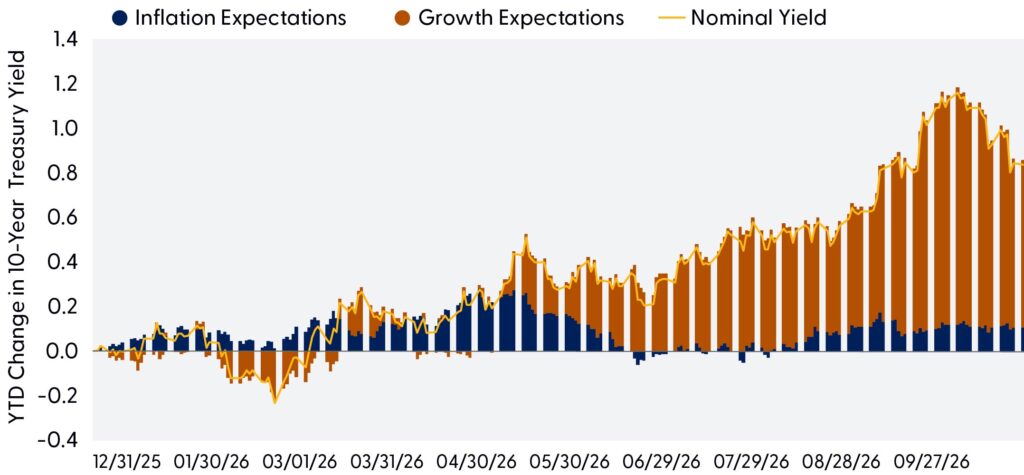
In our view, this is mostly a real-rate story, not an inflation-expectations story. The spread between the 10-year Treasury and the 10-year Treasury Inflation-Protected Securities (TIPS) yield is generally consistent with the Fed’s 2% target over time. The elevated piece of the yield is the real rate. In plain terms, the market believes the economy can sustain a higher policy rate because AI investment is propping up demand. Markets still expect one more hike this year and two more in 2027. That pricing is the opportunity if the AI impulse fades.
10-Year Nominal Treasury Yield Change Broken Out by Inflation and Growth Drivers
Source: LPL Research, Bloomberg 10/26/26
Disclosure: Past performance is no guarantee of future results.
Channel Two: AI Borrowers Are Crowding the Long End
The second channel is supply, and it hits the long end hardest. Data centers have long economic lives, so hyperscalers are matching them with long debt. Amazon’s $25 billion July deal is a good example: $9 billion of it, more than a third, was in 20-, 30-, and 40-year bonds and Alphabet’s $25 billion August deal also ran out to 40 years. As well, last week, Microsoft tapped the U.S. bond markets for the first time since 2017, issuing $25 billion of senior notes across 10 tranches with maturities from two to 40 years.
That duration has to be absorbed by the same buyers that anchor the long Treasury market: pensions, insurers, and long-duration asset managers. A $4 billion 30-year corporate tranche takes up liability-matching capacity that would otherwise flow into 30-year Treasuries. And investors who buy the corporates and hedge their rate risk by selling Treasury futures add a second round of pressure at the same point on the curve. Put another way, AI issuance is not just a credit supply story. It is a duration supply story layered on top of record Treasury supply.
Three anecdotes from the past few months show how this plays out:
- The Treasury Department is fighting for the same buyers. On August 19, after the 30-year yield hit 5.34%, its highest since 2007, the Treasury doubled the size of its long-end buyback operations to at least $4 billion each. For perspective, Amazon’s single July deal put $9 billion of 20- to 40-year debt into the market, more than two of those buyback operations combined. The Treasury is retiring long duration with one hand; AI borrowers create it with the other.
- Treasury auctions are clearing at ever-higher yields. The 30-year auction cleared at the highest since 2001 in August, and even higher in September and October. Demand has held up, but only at a higher price, which is what a market absorbing more duration supply looks like.
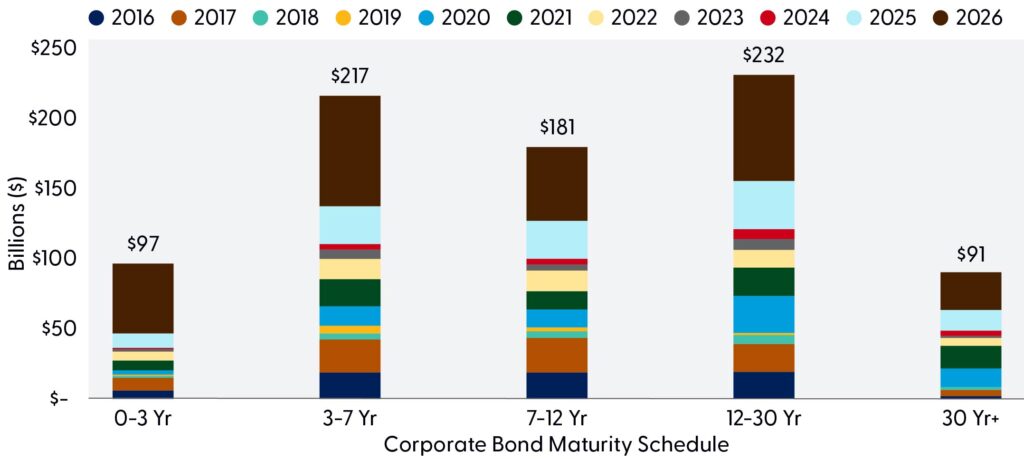
- AI issuance is bringing a lot more duration with it. Supply for 0–3-year maturities is about $6 billion more than the 30-year-plus supply, but par value alone misses the impact on the market. Adjusting for interest-rate sensitivity, the 30-year-plus bucket represents more than 10 times the duration-equivalent supply. And faced with a choice between Uncle Sam and the AI buildout, investors currently appear willing to take their chances with the machines.
Hyperscaler Issuance is Broad-Based but Adds Long-Duration Pressures to the Market
Source: LPL Research, Bloomberg 10/26/26
Disclosure: Past performance is no guarantee of future results.
That said, AI supply is a marginal force on the long end, not the root cause. Large deficits, a shrinking pool of price-insensitive buyers, and sticky inflation remain the structural drivers of term premium. But margins matter at these yield levels. AI issuance adds a steady, price-insensitive supplier of long corporate duration at exactly the moment the Treasury market is struggling to find price-insensitive buyers. And because hyperscalers expect returns on AI investment well above their borrowing costs, wider spreads are not slowing them down. That makes the supply technical sticky for as long as the buildout continues.
The Issuance Wave: The Primary Market is Already Straining (Somewhat)
Alphabet, Amazon, Meta, and Oracle have issued more than $228 billion of bonds this year as of October 13, more than double their total for all of 2025. The deals themselves tell the story of a market that is still open but no longer easy.
Two trends stand out. First, demand is fading at the margin. Cover ratios on hyperscaler deals slipped from nearly five times in February to below two times in July. Second, financing is migrating into project bonds and joint ventures, which keep debt off hyperscaler balance sheets but still put long-dated AI paper into the market.
The borrower base is also broadening well beyond the big five, which is how a sector story becomes a market-wide supply story. All told, investment-grade companies have sold about $1.9 trillion of bonds this year, up roughly 25% from a year earlier, led by mega cap technology. We expect the pipeline to get bigger, not smaller.
The Secondary Market: Supply Repricing, with a Credit Tail
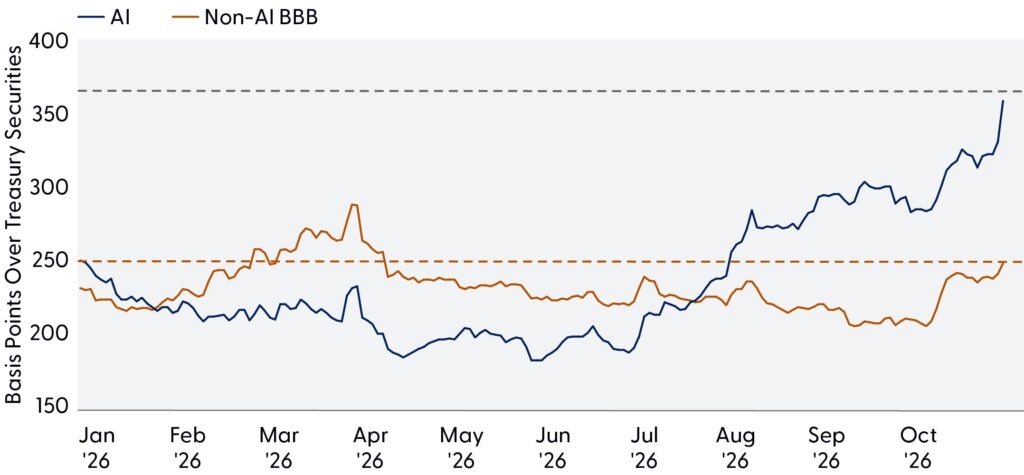
The clearest sign that AI has become its own credit story is how far its spreads have moved away from everyone else. In both investment grade and high yield, AI-related borrowers have widened while the rest of the market has held near historically tight levels.
In investment grade, the gap is about supply, not solvency. When the widening is limited to one group of borrowers, it tells us investors are asking to be paid for absorbing more supply, not for a weaker balance sheet.
Spreads for Investment Grade AI Companies Have Widened…(USD Investment-Grade Spreads)
Source: LPL Research, Bloomberg 10/26/26
Disclosure: Bloomberg Corporate Bond Index. Indexes are unmanaged and cannot be invested in directly. Past performance is no guarantee of future results.
In high yield, the gap is about credit risk, and it is much wider. The broad high yield market has been calm, but the AI-linked corner looks very different. CoreWeave, rated B+, saw its October 2031 bonds yield above 16% in mid-October, and its five-year credit default swap hit a record of about 1,195 basis points.
…Alongside Those For High-Yield (USD High-Yield Spreads)
Source: LPL Research, Bloomberg 10/26/26
Disclosure: Bloomberg High Yield Index. Indexes are unmanaged and cannot be invested in directly. Past performance is no guarantee of future results.
Our read: the divergence is rational, and it is not finished. In investment grade, the spread gap will track the pace of issuance, so it should narrow if the buildout slows and supply eases. In high yield, the gap reflects real exposure to the buildout itself. That is where losses would show up first if AI spending slows. A slowdown that is good news for Treasuries and high-quality hyperscaler bonds would be bad news for the leveraged end of AI credit.
Conclusion
The asymmetry favors bondholders who are patient with duration and disciplined with credit. Markets are priced for an AI buildout that keeps surprising to the upside. If it continues, yields are already near two-decade highs, so investors are getting paid to hold high-quality fixed income. If it falters, the rally could be fast.
The AI buildout may well deliver the productivity gains that eventually bring inflation and rates down. But that is a 2028 (at the earliest) and beyond story. For the next 12 months, AI is likely a headwind for bonds, but the surest way for that headwind to fade is for the spending to slow. Until then, the buildout may be fabulous. The debt that finances it may be another story.
Asset Allocation Insights
We’re neutral duration relative to benchmarks on the competing narrative of the AI story and any potential slowdown. But keeping some duration in portfolios is worth considering given starting yields for 10- and two-years provide a cushion if the buildout continues, and the intermediate part of the curve is most sensitive to a repricing of the Fed path. That is where an AI slowdown can positively impact bondholders most directly. However, the long end should be kept on a shorter leash, in our view. Fiscal deficits and price-insensitive corporate supply will keep term premium elevated even in a slowdown. We would not chase 30-year Treasuries until AI issuance shows signs of cresting.
In credit, we believe hyperscalers should be treated as a supply trade, not a credit trade, and we would be more cautious on long-dated hyperscaler paper ahead of what we expect to be even heavier supply in 2027. Lastly, neocloud borrowers, BBB issuers with heavy data center lease commitments, and project vehicles that depend on a single tenant carry the real AI credit risk. Their spreads are the proverbial canary in the coal mine. Be cautious.
Disclosures
This material is for general information only and is not intended to provide specific advice or recommendations for any individual. There is no assurance that the views or strategies discussed are suitable for all investors or will yield positive outcomes. Investing involves risks including possible loss of principal. Any economic forecasts set forth may not develop as predicted and are subject to change.
References to markets, asset classes, and sectors are generally regarding the corresponding market index. Indexes are unmanaged statistical composites and cannot be invested into directly. Index performance is not indicative of the performance of any investment and do not reflect fees, expenses, or sales charges. All performance referenced is historical and is no guarantee of future results.
Any company names noted herein are for educational purposes only and not an indication of trading intent or a solicitation of their products or services. LPL Financial doesn’t provide research on individual equities.
All information is believed to be from reliable sources; however, LPL Financial makes no representation as to its completeness or accuracy.
All investing involves risk, including possible loss of principal.
US Treasuries may be considered “safe haven” investments but do carry some degree of risk including interest rate, credit, and market risk. Bonds are subject to market and interest rate risk if sold prior to maturity. Bond values will decline as interest rates rise and bonds are subject to availability and change in price.
The Standard & Poor’s 500 Index (S&P500) is a capitalization-weighted index of 500 stocks designed to measure performance of the broad domestic economy through changes in the aggregate market value of 500 stocks representing all major industries.
The PE ratio (price-to-earnings ratio) is a measure of the price paid for a share relative to the annual net income or profit earned by the firm per share. It is a financial ratio used for valuation: a higher PE ratio means that investors are paying more for each unit of net income, so the stock is more expensive compared to one with lower PE ratio.
Earnings per share (EPS) is the portion of a company’s profit allocated to each outstanding share of common stock. EPS serves as an indicator of a company’s profitability. Earnings per share is generally considered to be the single most important variable in determining a share’s price. It is also a major component used to calculate the price-to-earnings valuation ratio.
All index data from FactSet or Bloomberg. All index data from FactSet or Bloomberg.
This research material has been prepared by LPL Financial LLC.
Not Insured by FDIC/NCUA or Any Other Government Agency | Not Bank/Credit Union Guaranteed | Not Bank/Credit Union Deposits or Obligations| May Lose Value
For public use.
Member FINRA/SIPC.
RES-0007122-0526 | For Public Use | Tracking #1200588 (Exp. 11/2027)