Printer Friendly Version
Chinese equities have been a major focus for investors in recent months, with catalysts ranging from DeepSeek’s artificial intelligence (AI) advancements to tariffs and trade negotiations. However, the performance of Chinese equities has varied significantly depending on the particular equity market in question. Unlike many other global equity markets, China’s stock market is divided into distinct segments, each with unique characteristics and investor access. Understanding these differences is crucial to assessing how Chinese equities have responded to recent events and what is in store for them and emerging market equities more broadly moving forward.
Understanding the Different Chinese Equity Markets
A-shares represent publicly listed mainland Chinese companies that trade on domestic exchanges such as the Shanghai and Shenzhen Stock Exchanges. These shares are denominated in Chinese Yuan (CNY) and are less accessible to foreign investors due to regulatory restrictions. For average U.S. investors, exposure to A-shares is typically limited to mutual funds or select American Depository Receipts (ADRs). In contrast, H-shares are shares of mainland Chinese companies listed on the Hong Kong Stock Exchange. While these shares are issued under Chinese law, they must meet Hong Kong’s listing requirements and are denominated in Hong Kong Dollars (HKD). Unlike A shares, H-shares are freely tradable by foreign investors, making them the preferred avenue for international market participants seeking exposure to Chinese equities. There is also a B-share market, but it is much less relevant in the broader investment landscape. The key distinction between A-shares and H-shares lies in their investor base — A shares primarily reflect domestic sentiment, while H-shares serve as a gauge of foreign interest in Chinese stocks.
Divergent Trends in Chinese Equities
So far in 2025, A-shares and H-shares have moved in opposite directions, highlighting the divergence in investor sentiment between domestic and international participants. A-shares, as represented by the CSI 300 Index, have struggled, remaining stuck in a tight range and posting losses for the year. Domestic investors have remained cautious, particularly as government stimulus measures announced last year have underwhelmed and failed to produce meaningful economic improvements. When stimulus was first proposed in late summer 2024, A-shares experienced a nearly 40% rally, reflecting optimism about potential policy support. However, with little tangible impact so far, investor enthusiasm has faded, leaving A-shares in a state of stagnation.
A-shares Stuck in the Doldrums
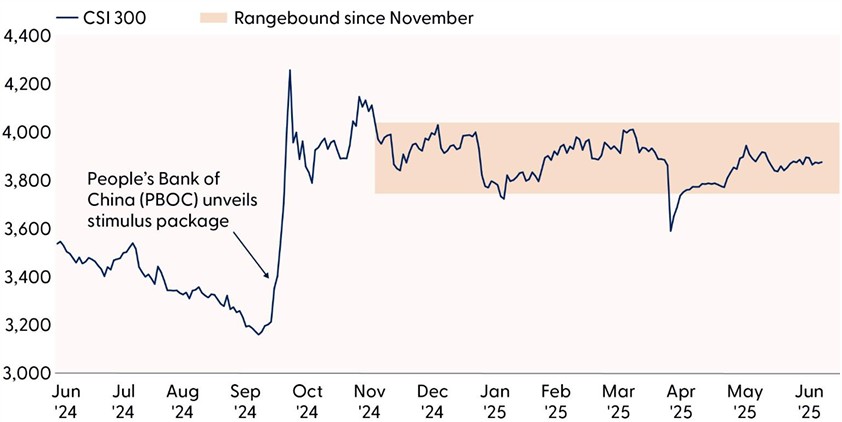
Source: LPL Research, Bloomberg 06/18/25
Disclosures: Past performance is no guarantee of future results. All indexes are unmanaged and can’t be invested in directly.
Momentum Builds in H-Shares
Meanwhile, H-shares, as represented by the Hang Seng China Enterprises Index (HSCEI), have performed significantly better, rallying nearly 20% since December and approaching three-year highs. Not surprisingly, foreign investor interest has been a key driver of this strength, fueled by major recent initial public offerings (IPOs) and progress in trade negotiations. The DeepSeek announcement initially sparked enthusiasm for Chinese tech stocks, contributing to a broader international rotation into the market. This surge in interest was part of a larger de dollarization narrative that gained traction earlier in the year, as investors sought to more actively diversify away from U.S. assets. However, with the resurgence of the “Magnificent Seven” and the recent outperformance of U.S. equities, the de-dollarization theme has lost some momentum. Despite this shift, the HSCEI has remained resilient, suggesting that foreign appetite for Chinese equities may be more durable this time after several false starts over the past five years.
From a technical perspective, H-shares are showing signs of real and potentially longer lasting strength. The 200 day moving average (dma) for the HSCEI has been upward sloping since September, indicating a more enduring uptrend is in place. Additionally, the index successfully held the 200-dma as support during the global turmoil in April. Most major global indexes did not, and the fact that investors were so eager to take advantage of the weakness in H-shares at such a psychologically significant level was a clear sign that sentiment has meaningfully started to shift for the better in the H-share market. Another encouraging sign is the broadening of market leadership beyond the tech sector, with non-tech industries beginning to drive gains. This broadening out of the market suggests that the rally is not solely dependent on a single sector, potentially making it more durable.
H-shares Rally Displays Durability
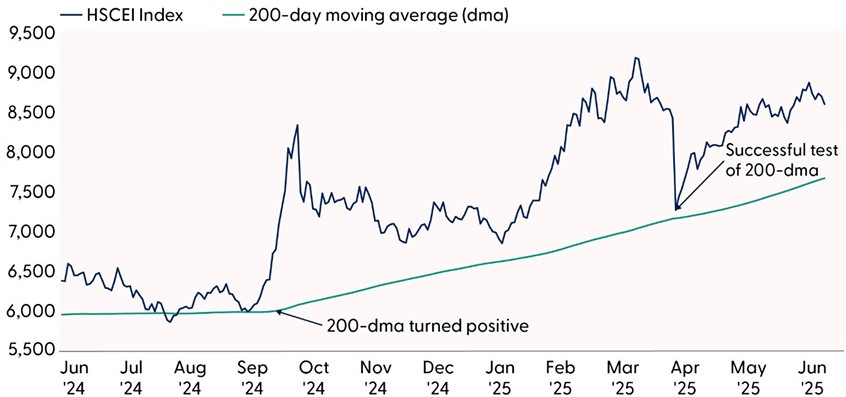
Source: LPL Research, Bloomberg 06/18/25
Disclosures: Past performance is no guarantee of future results. All indexes are unmanaged and can’t be invested in directly.
What’s Next?
Looking ahead, the trajectory of Chinese equities will depend on several key factors. For A-shares, the ability of government stimulus measures to generate meaningful economic improvements will be critical in determining whether domestic investor sentiment can recover. If policy support begins to show tangible results, A-shares could break out of their current malaise and regain upward momentum. The yield on 10-year Chinese government bonds will serve as an important barometer of whether the economy is starting to shift. Currently, it remains in an entrenched downtrend, and investors will want to see a reversal to signal that a more viable economic turnaround is underway in China.
For H-shares, less sporadic and more steady foreign investor inflows will be essential in sustaining recent momentum. While geopolitical risks and trade uncertainties remain, the recent strength in H-shares suggests that international investors are increasingly viewing Chinese equities as a viable place to allocate again. If this trend persists, it will have ramifications. Chinese stocks comprise over 25% of most major emerging market equity benchmarks, and a sustained rebound could have significant ripple effects across broader emerging market equities.
Asset Allocation Insights
In May, the LPL Research Strategic and Tactical Asset Allocation Committee (STAAC) raised its outlook on emerging markets (EM) equities to neutral from underweight, reflecting both fundamental and technical improvements in the category. The decision was also influenced by the STAAC’s desire to stay closer to benchmarks amid greater policy uncertainty. EM equity valuations remain attractive, and the burgeoning downtrend in the U.S. dollar offers additional upside potential for international equities. Additionally, easing trade tensions with China have contributed to a more favorable environment for EM equities and investors may increasingly view EM as an attractive option for growth and diversification in the second half. Overall, the STAAC maintains its tactical neutral stance on equities, with a preference for large caps over small and growth over value. LPL Research continues to monitor tariff negotiations, the Israel-Iran conflict, economic data, earnings, the bond market, and various technical indicators to identify a potentially more attractive entry point to add equities on weakness.
For fixed income, the STAAC holds a neutral weight in core bonds, with a slight preference for mortgage-backed securities (MBS) over investment-grade corporates. The Committee remains neutral duration relative to benchmarks, favoring the intermediate part of the yield curve.
Important Disclosures
This material is for general information only and is not intended to provide specific advice or recommendations for any individual. There is no assurance that the views or strategies discussed are suitable for all investors or will yield positive outcomes. Investing involves risks including possible loss of principal. Any economic forecasts set forth may not develop as predicted and are subject to change.
References to markets, asset classes, and sectors are generally regarding the corresponding market index. Indexes are unmanaged statistical composites and cannot be invested into directly. Index performance is not indicative of the performance of any investment and do not reflect fees, expenses, or sales charges. All performance referenced is historical and is no guarantee of future results.
Any company names noted herein are for educational purposes only and not an indication of trading intent or a solicitation of their products or services. LPL Financial doesn’t provide research on individual equities.
All information is believed to be from reliable sources; however, LPL Financial makes no representation as to its completeness or accuracy.
All investing involves risk, including possible loss of principal.
US Treasuries may be considered “safe haven” investments but do carry some degree of risk including interest rate, credit, and market risk. Bonds are subject to market and interest rate risk if sold prior to maturity. Bond values will decline as interest rates rise and bonds are subject to availability and change in price.
The Standard & Poor’s 500 Index (S&P500) is a capitalization-weighted index of 500 stocks designed to measure performance of the broad domestic economy through changes in the aggregate market value of 500 stocks representing all major industries.
The PE ratio (price-to-earnings ratio) is a measure of the price paid for a share relative to the annual net income or profit earned by the firm per share. It is a financial ratio used for valuation: a higher PE ratio means that investors are paying more for each unit of net income, so the stock is more expensive compared to one with lower PE ratio.
Earnings per share (EPS) is the portion of a company’s profit allocated to each outstanding share of common stock. EPS serves as an indicator of a company’s profitability. Earnings per share is generally considered to be the single most important variable in determining a share’s price. It is also a major component used to calculate the price-to-earnings valuation ratio.
All index data from FactSet or Bloomberg.
This research material has been prepared by LPL Financial LLC.
Not Insured by FDIC/NCUA or Any Other Government Agency | Not Bank/Credit Union Guaranteed | Not Bank/Credit Union Deposits or Obligations | May Lose Value
For public use.
Member FINRA/SIPC.
RES-0004479-0525 Tracking #757861 | #757864 (Exp. 06/26)
China’s Equity Market Diverges: A Shares vs. H-Shares | Weekly Market Commentary | June 23, 2025
Printer Friendly Version
Chinese equities have been a major focus for investors in recent months, with catalysts ranging from DeepSeek’s artificial intelligence (AI) advancements to tariffs and trade negotiations. However, the performance of Chinese equities has varied significantly depending on the particular equity market in question. Unlike many other global equity markets, China’s stock market is divided into distinct segments, each with unique characteristics and investor access. Understanding these differences is crucial to assessing how Chinese equities have responded to recent events and what is in store for them and emerging market equities more broadly moving forward.
Understanding the Different Chinese Equity Markets
A-shares represent publicly listed mainland Chinese companies that trade on domestic exchanges such as the Shanghai and Shenzhen Stock Exchanges. These shares are denominated in Chinese Yuan (CNY) and are less accessible to foreign investors due to regulatory restrictions. For average U.S. investors, exposure to A-shares is typically limited to mutual funds or select American Depository Receipts (ADRs). In contrast, H-shares are shares of mainland Chinese companies listed on the Hong Kong Stock Exchange. While these shares are issued under Chinese law, they must meet Hong Kong’s listing requirements and are denominated in Hong Kong Dollars (HKD). Unlike A shares, H-shares are freely tradable by foreign investors, making them the preferred avenue for international market participants seeking exposure to Chinese equities. There is also a B-share market, but it is much less relevant in the broader investment landscape. The key distinction between A-shares and H-shares lies in their investor base — A shares primarily reflect domestic sentiment, while H-shares serve as a gauge of foreign interest in Chinese stocks.
Divergent Trends in Chinese Equities
So far in 2025, A-shares and H-shares have moved in opposite directions, highlighting the divergence in investor sentiment between domestic and international participants. A-shares, as represented by the CSI 300 Index, have struggled, remaining stuck in a tight range and posting losses for the year. Domestic investors have remained cautious, particularly as government stimulus measures announced last year have underwhelmed and failed to produce meaningful economic improvements. When stimulus was first proposed in late summer 2024, A-shares experienced a nearly 40% rally, reflecting optimism about potential policy support. However, with little tangible impact so far, investor enthusiasm has faded, leaving A-shares in a state of stagnation.
A-shares Stuck in the Doldrums
Source: LPL Research, Bloomberg 06/18/25
Disclosures: Past performance is no guarantee of future results. All indexes are unmanaged and can’t be invested in directly.
Momentum Builds in H-Shares
Meanwhile, H-shares, as represented by the Hang Seng China Enterprises Index (HSCEI), have performed significantly better, rallying nearly 20% since December and approaching three-year highs. Not surprisingly, foreign investor interest has been a key driver of this strength, fueled by major recent initial public offerings (IPOs) and progress in trade negotiations. The DeepSeek announcement initially sparked enthusiasm for Chinese tech stocks, contributing to a broader international rotation into the market. This surge in interest was part of a larger de dollarization narrative that gained traction earlier in the year, as investors sought to more actively diversify away from U.S. assets. However, with the resurgence of the “Magnificent Seven” and the recent outperformance of U.S. equities, the de-dollarization theme has lost some momentum. Despite this shift, the HSCEI has remained resilient, suggesting that foreign appetite for Chinese equities may be more durable this time after several false starts over the past five years.
From a technical perspective, H-shares are showing signs of real and potentially longer lasting strength. The 200 day moving average (dma) for the HSCEI has been upward sloping since September, indicating a more enduring uptrend is in place. Additionally, the index successfully held the 200-dma as support during the global turmoil in April. Most major global indexes did not, and the fact that investors were so eager to take advantage of the weakness in H-shares at such a psychologically significant level was a clear sign that sentiment has meaningfully started to shift for the better in the H-share market. Another encouraging sign is the broadening of market leadership beyond the tech sector, with non-tech industries beginning to drive gains. This broadening out of the market suggests that the rally is not solely dependent on a single sector, potentially making it more durable.
H-shares Rally Displays Durability
Source: LPL Research, Bloomberg 06/18/25
Disclosures: Past performance is no guarantee of future results. All indexes are unmanaged and can’t be invested in directly.
What’s Next?
Looking ahead, the trajectory of Chinese equities will depend on several key factors. For A-shares, the ability of government stimulus measures to generate meaningful economic improvements will be critical in determining whether domestic investor sentiment can recover. If policy support begins to show tangible results, A-shares could break out of their current malaise and regain upward momentum. The yield on 10-year Chinese government bonds will serve as an important barometer of whether the economy is starting to shift. Currently, it remains in an entrenched downtrend, and investors will want to see a reversal to signal that a more viable economic turnaround is underway in China.
For H-shares, less sporadic and more steady foreign investor inflows will be essential in sustaining recent momentum. While geopolitical risks and trade uncertainties remain, the recent strength in H-shares suggests that international investors are increasingly viewing Chinese equities as a viable place to allocate again. If this trend persists, it will have ramifications. Chinese stocks comprise over 25% of most major emerging market equity benchmarks, and a sustained rebound could have significant ripple effects across broader emerging market equities.
Asset Allocation Insights
In May, the LPL Research Strategic and Tactical Asset Allocation Committee (STAAC) raised its outlook on emerging markets (EM) equities to neutral from underweight, reflecting both fundamental and technical improvements in the category. The decision was also influenced by the STAAC’s desire to stay closer to benchmarks amid greater policy uncertainty. EM equity valuations remain attractive, and the burgeoning downtrend in the U.S. dollar offers additional upside potential for international equities. Additionally, easing trade tensions with China have contributed to a more favorable environment for EM equities and investors may increasingly view EM as an attractive option for growth and diversification in the second half. Overall, the STAAC maintains its tactical neutral stance on equities, with a preference for large caps over small and growth over value. LPL Research continues to monitor tariff negotiations, the Israel-Iran conflict, economic data, earnings, the bond market, and various technical indicators to identify a potentially more attractive entry point to add equities on weakness.
For fixed income, the STAAC holds a neutral weight in core bonds, with a slight preference for mortgage-backed securities (MBS) over investment-grade corporates. The Committee remains neutral duration relative to benchmarks, favoring the intermediate part of the yield curve.
Important Disclosures
This material is for general information only and is not intended to provide specific advice or recommendations for any individual. There is no assurance that the views or strategies discussed are suitable for all investors or will yield positive outcomes. Investing involves risks including possible loss of principal. Any economic forecasts set forth may not develop as predicted and are subject to change.
References to markets, asset classes, and sectors are generally regarding the corresponding market index. Indexes are unmanaged statistical composites and cannot be invested into directly. Index performance is not indicative of the performance of any investment and do not reflect fees, expenses, or sales charges. All performance referenced is historical and is no guarantee of future results.
Any company names noted herein are for educational purposes only and not an indication of trading intent or a solicitation of their products or services. LPL Financial doesn’t provide research on individual equities.
All information is believed to be from reliable sources; however, LPL Financial makes no representation as to its completeness or accuracy.
All investing involves risk, including possible loss of principal.
US Treasuries may be considered “safe haven” investments but do carry some degree of risk including interest rate, credit, and market risk. Bonds are subject to market and interest rate risk if sold prior to maturity. Bond values will decline as interest rates rise and bonds are subject to availability and change in price.
The Standard & Poor’s 500 Index (S&P500) is a capitalization-weighted index of 500 stocks designed to measure performance of the broad domestic economy through changes in the aggregate market value of 500 stocks representing all major industries.
The PE ratio (price-to-earnings ratio) is a measure of the price paid for a share relative to the annual net income or profit earned by the firm per share. It is a financial ratio used for valuation: a higher PE ratio means that investors are paying more for each unit of net income, so the stock is more expensive compared to one with lower PE ratio.
Earnings per share (EPS) is the portion of a company’s profit allocated to each outstanding share of common stock. EPS serves as an indicator of a company’s profitability. Earnings per share is generally considered to be the single most important variable in determining a share’s price. It is also a major component used to calculate the price-to-earnings valuation ratio.
All index data from FactSet or Bloomberg.
This research material has been prepared by LPL Financial LLC.
Not Insured by FDIC/NCUA or Any Other Government Agency | Not Bank/Credit Union Guaranteed | Not Bank/Credit Union Deposits or Obligations | May Lose Value
For public use.
Member FINRA/SIPC.
RES-0004479-0525 Tracking #757861 | #757864 (Exp. 06/26)
Recent Posts
Categories
SIGN UP TO RECEIVE OUR WEEKLY NEWSLETTER
Sign up to get interesting news and updates delivered to your inbox.