Earnings drive stock prices over time, but not all the time. Clearly, we’re in an environment where stocks are moving on developments in the Mideast and related moves in oil prices and interest rates. At the risk of writing about something that markets may not care much about right now, here we share some thoughts on the upcoming earnings season and the earnings outlook for the rest of the year.
Despite the sharp rise in oil prices and interest rates in March, our expectation is that the upcoming earnings season will be solid. While companies with business models sensitive to oil and rates may strike a more cautious tone in their outlooks, we expect to again be impressed by the resilience of corporate America, bolstered by our energy independence.
Our confidence in the earnings outlook for 2026 has not wavered, and future earnings are available to investors at a discounted price following the stock market pullback. While today may not mark the stock market low, and our technical analysis work points to heightened risk of some additional near-term downside, our belief that 2026 will be a good year for stocks on the back of solid economic growth and strong earnings has not changed. Once a path to ending the conflict becomes clear and oil and interest rates come back down, stocks should get a nice jolt to the upside as earnings recapture investor attention.
Expect Earnings to Power Through the Fog
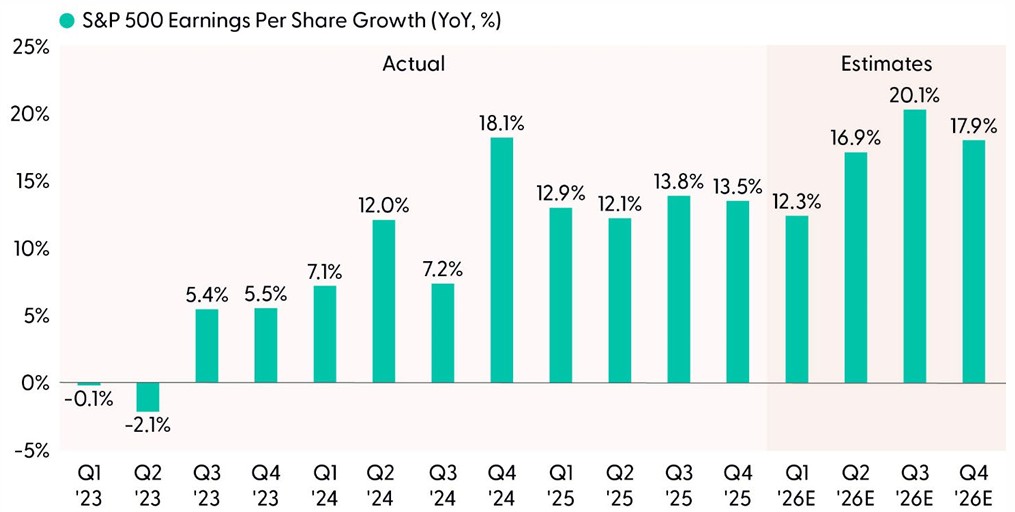
The consensus estimate for first quarter (Q1) earnings growth is 12.3%. As we know, barring a swift and sharp economic shock intra-quarter, companies do a tremendous job of beating estimates. In fact, S&P 500 earnings have historically beaten consensus estimates more than 90% of the time. We expect Q1 to be no different.
With a boost from higher energy sector profits and a year-over-year decline in the U.S. dollar, balanced against some additional costs and supply chain disruptions across certain industries, we expect earnings growth in the mid teens for the quarter. That would mark the sixth straight quarter of double-digit earnings growth.
Massive artificial intelligence (A) investment and fiscal stimulus from the One Big Beautiful Bill Act (OBBBA) provide a solid foundation for revenue growth. Strong exports out of South Korea and the latest bump up in manufacturing surveys add to our confidence that Q1 earnings will be solid.
That said, guidance may not be “clean” given not just higher oil prices but disruptions to commodity supply chains and transportation, and higher interest rates. This is why we’re not counting on estimates for the rest of the year to rise through reporting season (starting the week of April 13), with the exception of the energy sector and potentially technology depending on what happens with capital investment plans for the so-called hyperscalers building out AI data centers.
Double-Digit Earnings Growth Streak Poised to Continue
Source: LPL Research, FactSet, 03/26/26 Disclosures: All indexes are unmanaged and cannot be invested in directly. Past performance is no guarantee of future results. Estimates may not materialize as predicted and are subject to change.
AI Investment Isn’t Going Anywhere
Speaking of the hyperscalers, which will again be a huge earnings driver this quarter, expectations for capital investment in 2026 have risen to over $650 billion. In December 2025, when LPL Research published Outlook 2026: The Policy Engine, that forecast stood at $520 billion.
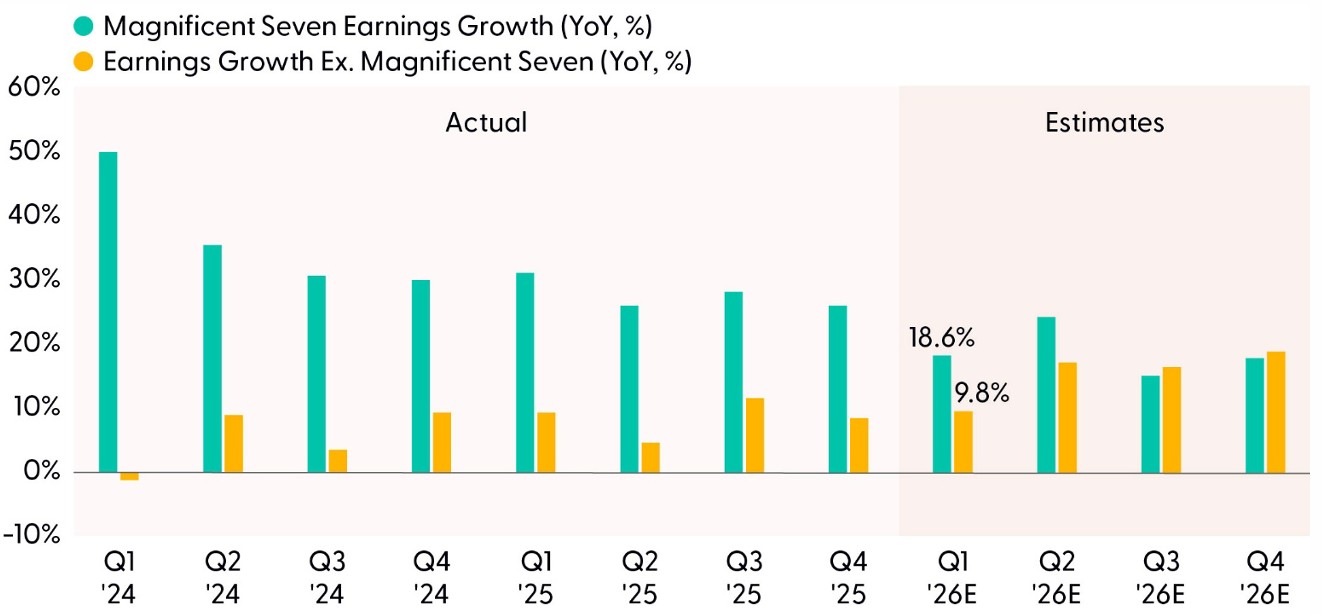
Based on current estimates, about 80% of the earnings growth for the S&P 500 in Q1 is expected to be driven by the technology sector, while the Magnificent (Mag) Seven alone is estimated to generate nearly half of S&P 500 earnings growth and grow earnings by about 19% based on current consensus estimates on an earnings-weighted basis.
That pace of growth from this group, which could likely exceed 25% when all the results are in, will probably more than double the earnings growth rate that the “S&P 493” will deliver. However, that gap is expected to narrow in coming quarters, something to watch closely given the recent struggles of these mega-cap technology stocks. The Mag Seven’s valuation, at a price-to-earnings ratio near 26, has come down but remains roughly 25% higher than the valuation for the rest of the S&P 500, aka the “493.”
This earnings growth gap supports LPL Research’s continued preference for large growth equities over their large value counterparts for now, but the leash has gotten shorter. The Mag Seven has slipped 13% year to date based on the Bloomberg Magnificent Seven Index, well behind the 5% drop in the S&P 500 over that time period.
Magnificent Seven Remains a Powerful Earnings Driver
Source: LPL Research, Bloomberg 03/26/26 Disclosure: All indexes are unmanaged and cannot be invested in directly. Past performance is no guarantee of future results. Estimates may not materialize as predicted and are subject to change.
Corporate America Has Managed Margin Pressures Remarkably Well
Corporate America has managed costs very well recently, enabling S&P 500 companies to expand operating margins for five straight quarters despite the incremental cost of tariffs. Recall, after the Supreme Court ruled tariffs enacted under the International Emergency Economic Powers Act were illegal, the Trump administration put them back on using a different legal authority. In addition, refunds will take quite some time, so they will not affect first quarter results. Bottom line, don’t look for margins to get a tariff boost, although the refund pool that is estimated at over $160 billion may drop into some importers’ coffers at some point down the road.
Just when companies figured out how to absorb tariffs and still expand margins, they are getting hit with more challenges in the form of higher oil prices, rising interest rates, and disrupted shipments of various materials and other goods through the Strait of Hormuz because of the Iran conflict. Although costs have risen for many companies that consume a lot of oil, particularly transportation-related companies like airlines, truckers, and cruise lines, corporate America overall is less energy-intensive than in the past. Companies are also gaining productivity from AI adoption and limited hiring. And the energy sector, though less than 5% of S&P 500 profits, is expanding margins due to high oil and gas prices, helping to offset some of the margin pressures other industries are experiencing.
In other words, the impact on margins from the Mideast conflict in the first quarter will likely be manageable, as is reflected in analysts’ estimates.
Profit Margin Expectations Are Likely Overly Optimistic Given Tariffs and Mideast Disruptions
Source: LPL Research, Bloomberg 03/26/26 Disclosure: All indexes are unmanaged and cannot be invested in directly. Past performance is no guarantee of future results. Estimates may not materialize as predicted and are subject to change.
Earnings Outlook for 2026 Still Bright
As always, we want to pay more attention to management guidance for future quarters than to the backward looking results from the prior quarter. In general, we expect management commentary to express greater uncertainty this quarter due to events in the Mideast and related uncertainty in the energy and rates markets. Companies with business models sensitive to oil and rates will likely strike a cautious tone in their outlooks even after reporting solid first quarter results. Nonetheless, bolstered by our energy independence, look for corporate America to impress in the first quarter.
The second quarter may be more difficult. Results carry more uncertainty as disruptions to shipping traffic through the Strait of Hormuz could continue well into the current quarter (though our base case calls for a resolution in April). Assuming a resolution is reached sometime within the next few weeks, the economic impact would be limited. That leaves solid 2.5%-plus GDP growth, the OBBBA stimulus, and massive AI investments as big earnings drivers. Rising consensus estimates for this year and next also point to a robust earnings outlook.
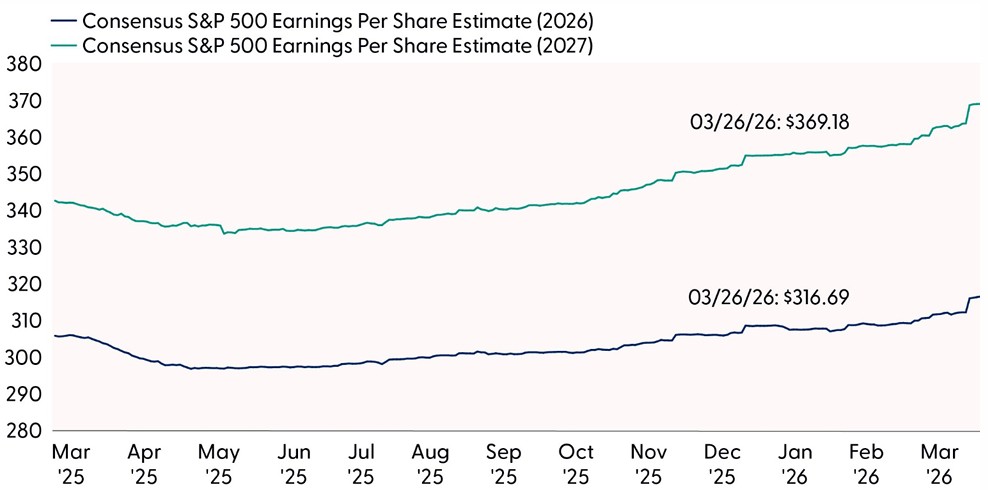
Bottom line, our high-single-digit S&P 500 earnings growth forecast for 2026, at $290 per share, is likely too low. We will strongly consider raising that forecast after earnings season is over and once there is greater clarity surrounding the resolution of the Mideast conflict. Our 10% S&P 500 earnings growth forecast for 2027, to $320 per share, looks reasonable given our macro forecasts.
S&P 500 Earnings Estimates Keep Going Higher Despite AI, Mideast Concerns
Source: LPL Research, Bloomberg 03/26/26 Disclosure: All indexes are unmanaged and cannot be invested in directly. Past performance is no guarantee of future results. Estimates may not materialize as predicted and are subject to change.
Technical Analysis Perspective
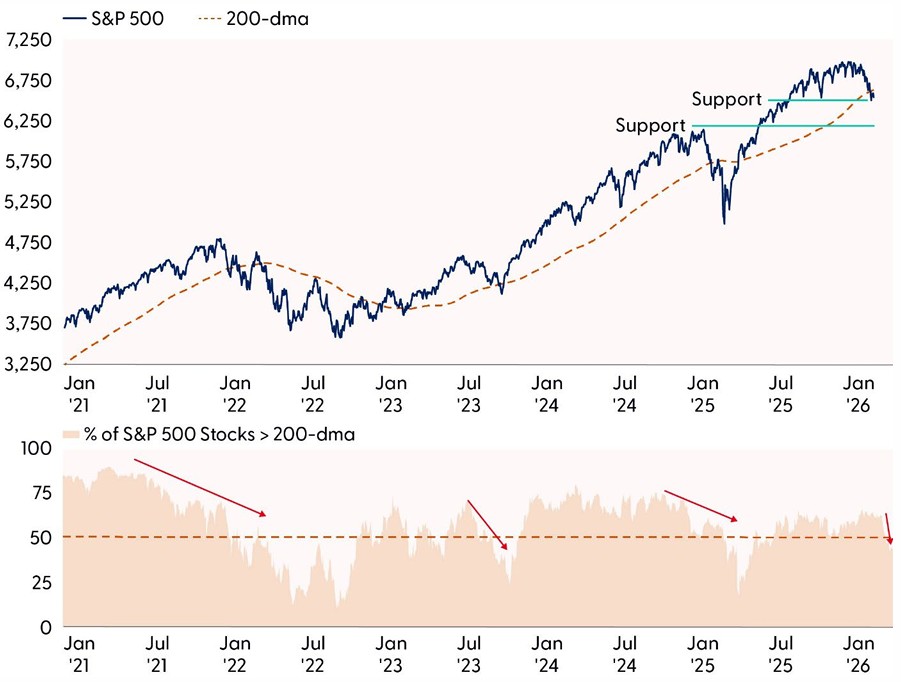
The broader market has moved into a more fragile state, with the S&P 500 now trading below both its widely followed 200‑day moving average (dma) and its November lows. Momentum has turned bearish, reflected in a consistent pattern of lower highs and lower lows over the past two months. Although oversold conditions are starting to emerge, most indicators have yet to reach the extreme levels that typically signal contrarian buying opportunities. For instance, only about 10% of S&P 500 stocks registered oversold Relative Strength Index readings on Friday, well below the +50% seen last April or the +20% levels observed during previous market corrections in recent years.
Investor positioning reinforces this cautious backdrop. Data from VandaXAsset shows that combined U.S. equity positioning has turned negative but remains far from levels historically associated with major turning points. Retail investors have meaningfully de‑risked from elevated exposure earlier in the year, though last week offered early hints of renewed buy‑the‑dip behavior. Rising volatility and weakening price trends have prompted further de‑risking among institutional investors, who are not only net short the broader market but also materially short interest rates.
Selling pressure has been widespread, and market internals continue to deteriorate. Only 43% of S&P 500 constituents remain above support from their November lows, with a similar share still holding above their 200‑dma. Breadth composition is also concerning, as defensive sectors have taken leadership. Technology, the market’s largest weight, has rolled over, while financials and consumer discretionary sit among the weakest areas in our technical work. A durable recovery will require renewed risk appetite across these sectors, along with meaningful technical improvements.
An Uncomfortable Spot for Stocks
Source: LPL Research, Bloomberg 03/26/26 Disclosure: All indexes are unmanaged and cannot be invested in directly. Past performance is no guarantee of future results.
Bottom line: The longer‑term bull market trend remains intact, but technical signals increasingly point to further downside risk for equities. While the recent deterioration in the S&P 500 has been meaningful, it has not yet reached the type of extremes that typically justify a contrarian stance. The index’s current discount has also failed to attract meaningful demand, as investors across the board continue to de‑risk. We continue to believe a buying opportunity will develop, but at this stage the risk‑reward profile does not warrant action. Below are six key technical indicators we are monitoring for signs of a potential inflection:
1) Oil is in the driver’s seat of risk appetite. Price stability in oil markets is key for a durable rebound in stocks. Brent crude falling below support at $98 would be a step in the right direction, especially if accompanied by a compression in longer-dated Brent futures contracts, which are still pricing in a higher-for-longer regime. In addition, implied volatility in oil will need to materially come down from historically high levels.
2) More widespread oversold conditions. Oversold conditions across equity markets are emerging, but most indicators have not yet entered washed-out territory.
3) Sentiment and positioning at capitulation levels. Bearish sentiment and investor positioning have not fallen to levels consistent with previous turning points. Stocks beginning to rise on relatively negative news would indicate that downside risks have been largely priced in.
4) Improvement in market breadth. With fewer than half of S&P 500 constituents currently in uptrends, a move back above the 50% threshold in our trend model would signal improving internal strength.
5) Rotation back toward cyclical leadership. A clear shift away from defensive leadership and back toward cyclical sectors would indicate renewed risk appetite.
6) Stability in interest rates. 10‑year Treasury yields holding below the 4.50–4.60% resistance range and a decline in 2‑year yields below the Federal Reserve’s 3.75% target rate would provide a more supportive backdrop for stocks.
Conclusion
Despite the near‑term uncertainty created by the Mideast conflict and its impact on oil, interest rates, and supply chains, the fundamental earnings backdrop remains constructive. Corporate America continues to demonstrate impressive resilience, supported by strong demand trends, massive AI‑driven investment, and fiscal stimulus, all of which position S&P 500 earnings for another year of solid growth. While management guidance may reflect understandable caution this quarter, the underlying drivers of profitability remain intact.
At the same time, technical conditions argue for patience. Market internals have weakened, investor positioning is defensive, and oversold signals have yet to reach levels that typically mark durable turning points. Together, these dynamics suggest that while the longer‑term outlook is favorable, the near‑term path may remain bumpy. As clarity around geopolitical developments improves and volatility subsides, the foundation appears set for earnings to reassert themselves as the primary driver of market direction.
Asset Allocation Insights
LPL’s Strategic Tactical Asset Allocation Committee (STAAC) maintains its tactical neutral stance on equities. As the war in Iran continues and oil prices have moved sharply higher, investors may be well served by bracing for additional volatility. The stock market’s resilient track record during geopolitical crises is reassuring, leaving STAAC to look for opportunities to potentially add equities at lower levels rather than remove equities due to what will likely be relatively short-term market disruption.
STAAC’s regional preferences across the U.S., developed international, and emerging markets (EM) are aligned with benchmarks. Attractive valuations in non-U.S. equities are offset by upward pressure in the U.S. dollar, although the Committee continues to watch EM closely for opportunities due to improvements in fundamentals and the technical analysis picture pre-Iran conflict.
The Committee still maintains a slight preference for growth over value tilt and large caps over small caps. In terms of domestic sectors, communication services remains an overweight, while the industrials sector was recently upgraded to overweight based on strong earnings momentum, technical trends, and tailwinds from fiscal spending and AI-driven investment.
Within fixed income, the STAAC holds a neutral weight in core bonds, with a slight preference for mortgage-backed securities (MBS) over investment-grade corporates. The Committee believes the risk-reward for core bond sectors (U.S. Treasury, agency MBS, investment-grade corporates) is more attractive than plus sectors. The Committee does not believe adding duration (interest rate sensitivity) at current levels is attractive and remains neutral relative to benchmarks.
Important Disclosures
This material is for general information only and is not intended to provide specific advice or recommendations for any individual. There is no assurance that the views or strategies discussed are suitable for all investors or will yield positive outcomes. Investing involves risks including possible loss of principal. Any economic forecasts set forth may not develop as predicted and are subject to change.
References to markets, asset classes, and sectors are generally regarding the corresponding market index. Indexes are unmanaged statistical composites and cannot be invested into directly. Index performance is not indicative of the performance of any investment and do not reflect fees, expenses, or sales charges. All performance referenced is historical and is no guarantee of future results.
Any company names noted herein are for educational purposes only and not an indication of trading intent or a solicitation of their products or services. LPL Financial doesn’t provide research on individual equities.
All information is believed to be from reliable sources; however, LPL Financial makes no representation as to its completeness or accuracy.
All investing involves risk, including possible loss of principal.
US Treasuries may be considered “safe haven” investments but do carry some degree of risk including interest rate, credit, and market risk. Bonds are subject to market and interest rate risk if sold prior to maturity. Bond values will decline as interest rates rise and bonds are subject to availability and change in price.
The Standard & Poor’s 500 Index (S&P500) is a capitalization-weighted index of 500 stocks designed to measure performance of the broad domestic economy through changes in the aggregate market value of 500 stocks representing all major industries.
The PE ratio (price-to-earnings ratio) is a measure of the price paid for a share relative to the annual net income or profit earned by the firm per share. It is a financial ratio used for valuation: a higher PE ratio means that investors are paying more for each unit of net income, so the stock is more expensive compared to one with lower PE ratio.
Earnings per share (EPS) is the portion of a company’s profit allocated to each outstanding share of common stock. EPS serves as an indicator of a company’s profitability. Earnings per share is generally considered to be the single most important variable in determining a share’s price. It is also a major component used to calculate the price-to-earnings valuation ratio.
All index data from FactSet or Bloomberg.
This research material has been prepared by LPL Financial LLC.
Not Insured by FDIC/NCUA or Any Other Government Agency | Not Bank/Credit Union Guaranteed | Not Bank/Credit Union Deposits or Obligations | May Lose Value
For public use. Member FINRA/SIPC. RES-0006767-0226 Tracking #1085166 | #1085169 (Exp. 03/27)