Has Stock Market Exuberance Become Irrational?
A strong quarter across major indexes. The second quarter is winding down and what a quarter it has been with the S&P 500 up 12.6% quarter to date, while the Nasdaq-100 and Russell 2000 are both up over 20%. Despite some twists and turns, the path of least resistance for stocks broadly remained up and to the right for much of the last three months.
The SpaceX IPO sparks the exuberance question. The powerful rally and the blockbuster initial public offering (IPO) of Elon Musk’s SpaceX (SPCX) have sparked the question whether market optimism has become excessive. To quote the thirteenth Chair of the Federal Reserve, Alan Greenspan, who passed away just one week ago and in 1996 famously asked: “How do we know when irrational exuberance has unduly escalated asset values, which then become subject to unexpected and prolonged contractions?”
Assessing the current environment. While we do not think the stock market is in a dot-com-style bubble, the Maestro’s question is a fair one. Here, we dive into some sentiment and positioning indicators to assess the exuberance.
Is Sentiment Getting Too Frothy?
One of the more popular ways to get a read on investor sentiment is the longstanding AAII survey. The weekly investor sentiment survey from the American Association of Individual Investors, or AAII, goes back to 1987. The survey asks individual investors if they are bullish or bearish. The latest reading of percentage of bullish investors on June 25, 2026, was slightly elevated at 44.9%, above the IPO-heavy 2021 (39.9%) and the year-to-date average (37.4%). The four-week average is a much more subdued 38.2%, close to the long-term average percentage of bulls, at 37.5%, since the survey began about 40 years ago. That average level has been reached in just 12 of 26 weeks this year. But before you start thinking this is the late 1990s, bulls exceeded 60% in 1996 when Greenspan made his famous remark and peaked in the mid-70s in early 2000. So, while this is just one survey and, of course, what institutions are doing matters more than what a group of retail traders are saying, this survey clearly falls short of irrational exuberance.
AAII Survey of Investment Sentiment Reveals Caution Among Individual Investors
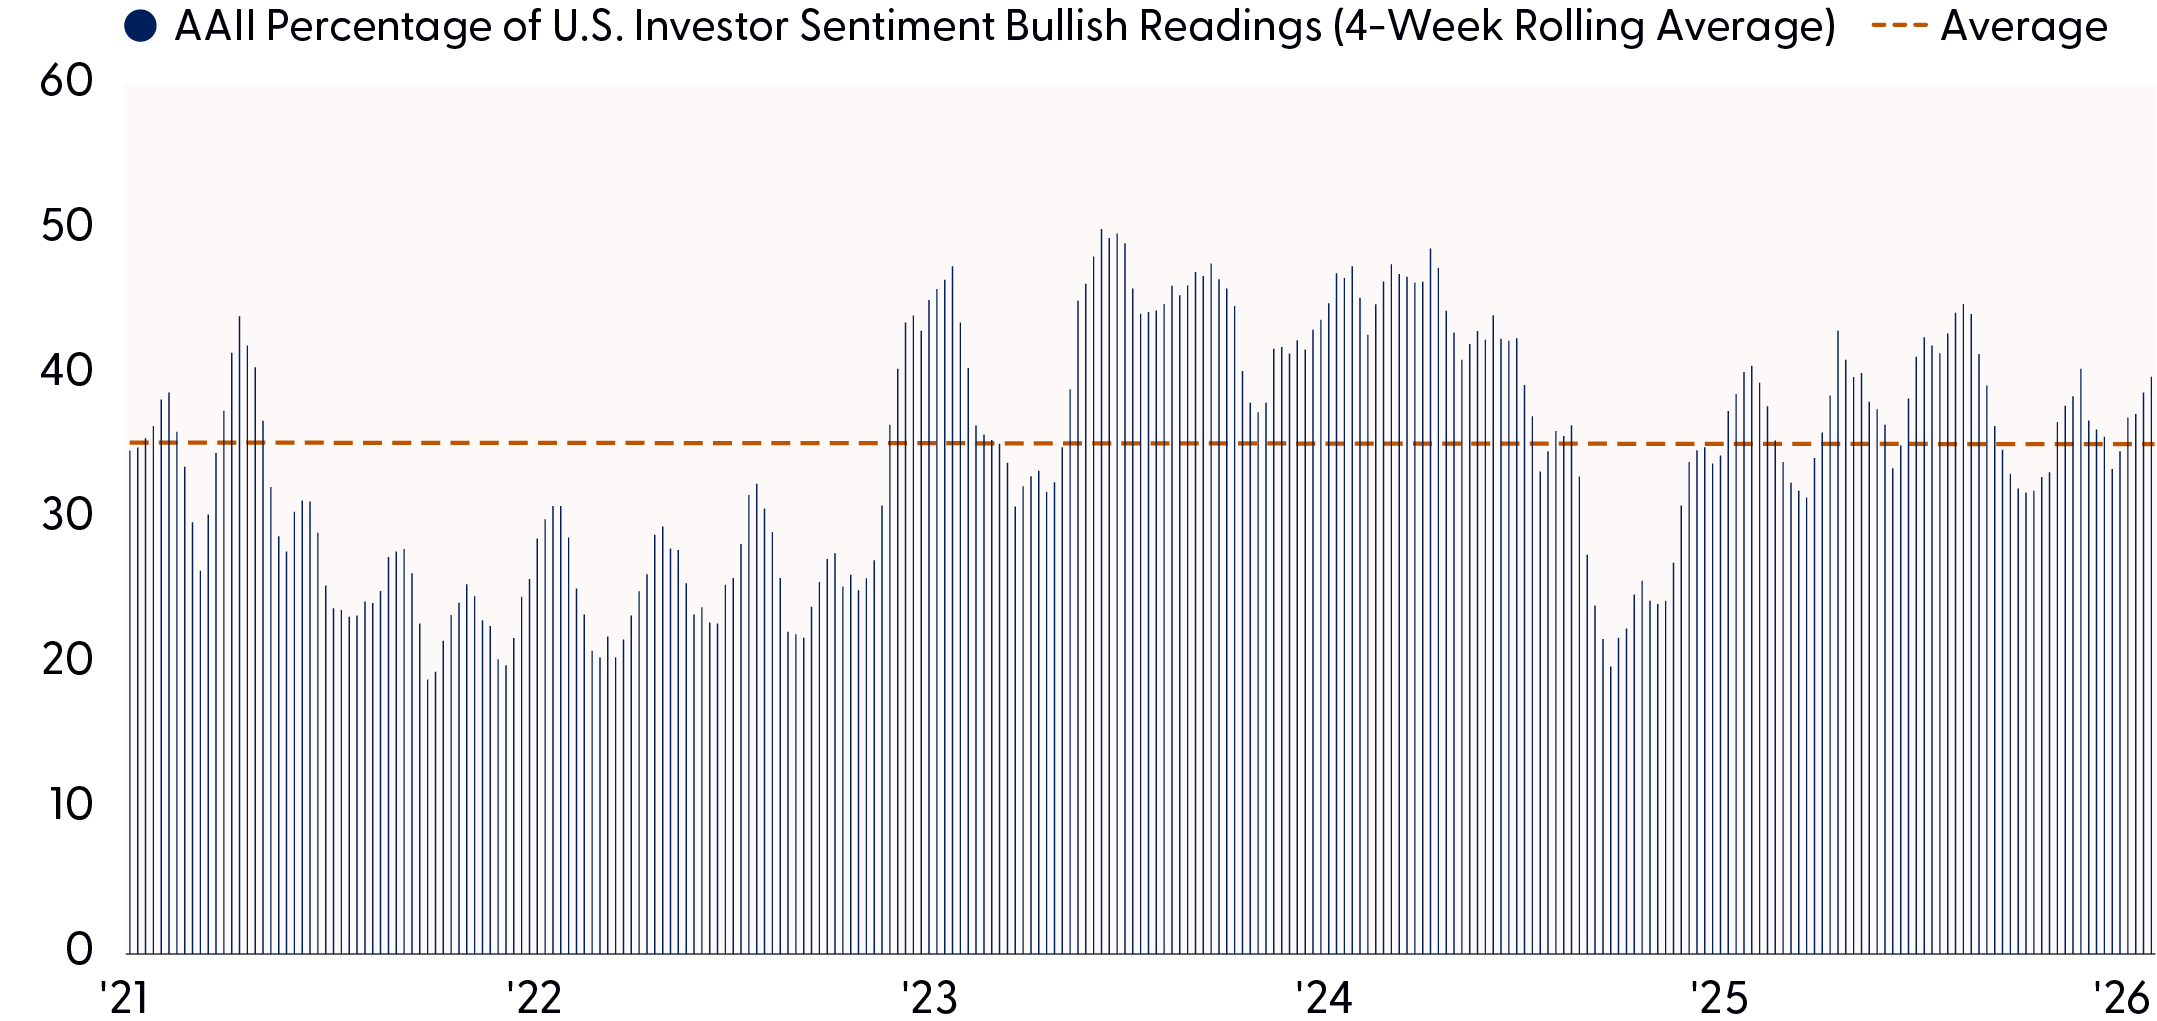
Source: LPL Research, Bloomberg, American Association of Individual Investors, 06/25/26
Disclosures: All indexes are unmanaged and cannot be invested in directly. Past performance is no guarantee of future results.
Sentiment Measured by Positioning Has Cooled Down But is Still Stretched
There are a lot of skeptics when it comes to surveys, so we place more weight on what investors are doing rather than what they are saying. To get a read on what investors are doing, with the help of our friends at Vanda, we can look at positioning. The chart below reflects equity positioning combined across several investor types and vehicles, including active mutual funds, long/short hedge funds, volatility-targeting and risk-parity strategies, CTAs (commonly referred to as managed futures), and single-stock and ETF options buying by both retail and institutional market participants.
The headline positioning indicator, which is standardized and z-scored, is typically within one standard deviation of the mean (zero). But when it gets closer to two standard deviations above or below zero, it indicates an extreme stretched positioning condition.
A reading near +2, where the indicator was in early June and back in October 2025, is indicative of stretched positioning to the bullish side, and a contrarian short-to-intermediate term sell signal. Conversely, a reading near -2 is stretched to the bearish side, which the indicator touched shortly after the Liberation Day tariff scare in April 2025, and is a contrarian buy signal.
The latest reading of +0.93, down from +2 just three weeks ago, reflects full but not particularly overly stretched market positioning. Historical analysis suggests a reading of +0.6 or less would be sufficiently balanced so the investment community still has a bit more optimism to work off but not much.
Positioning is Full and Points to a Consolidation or Modest Pullback
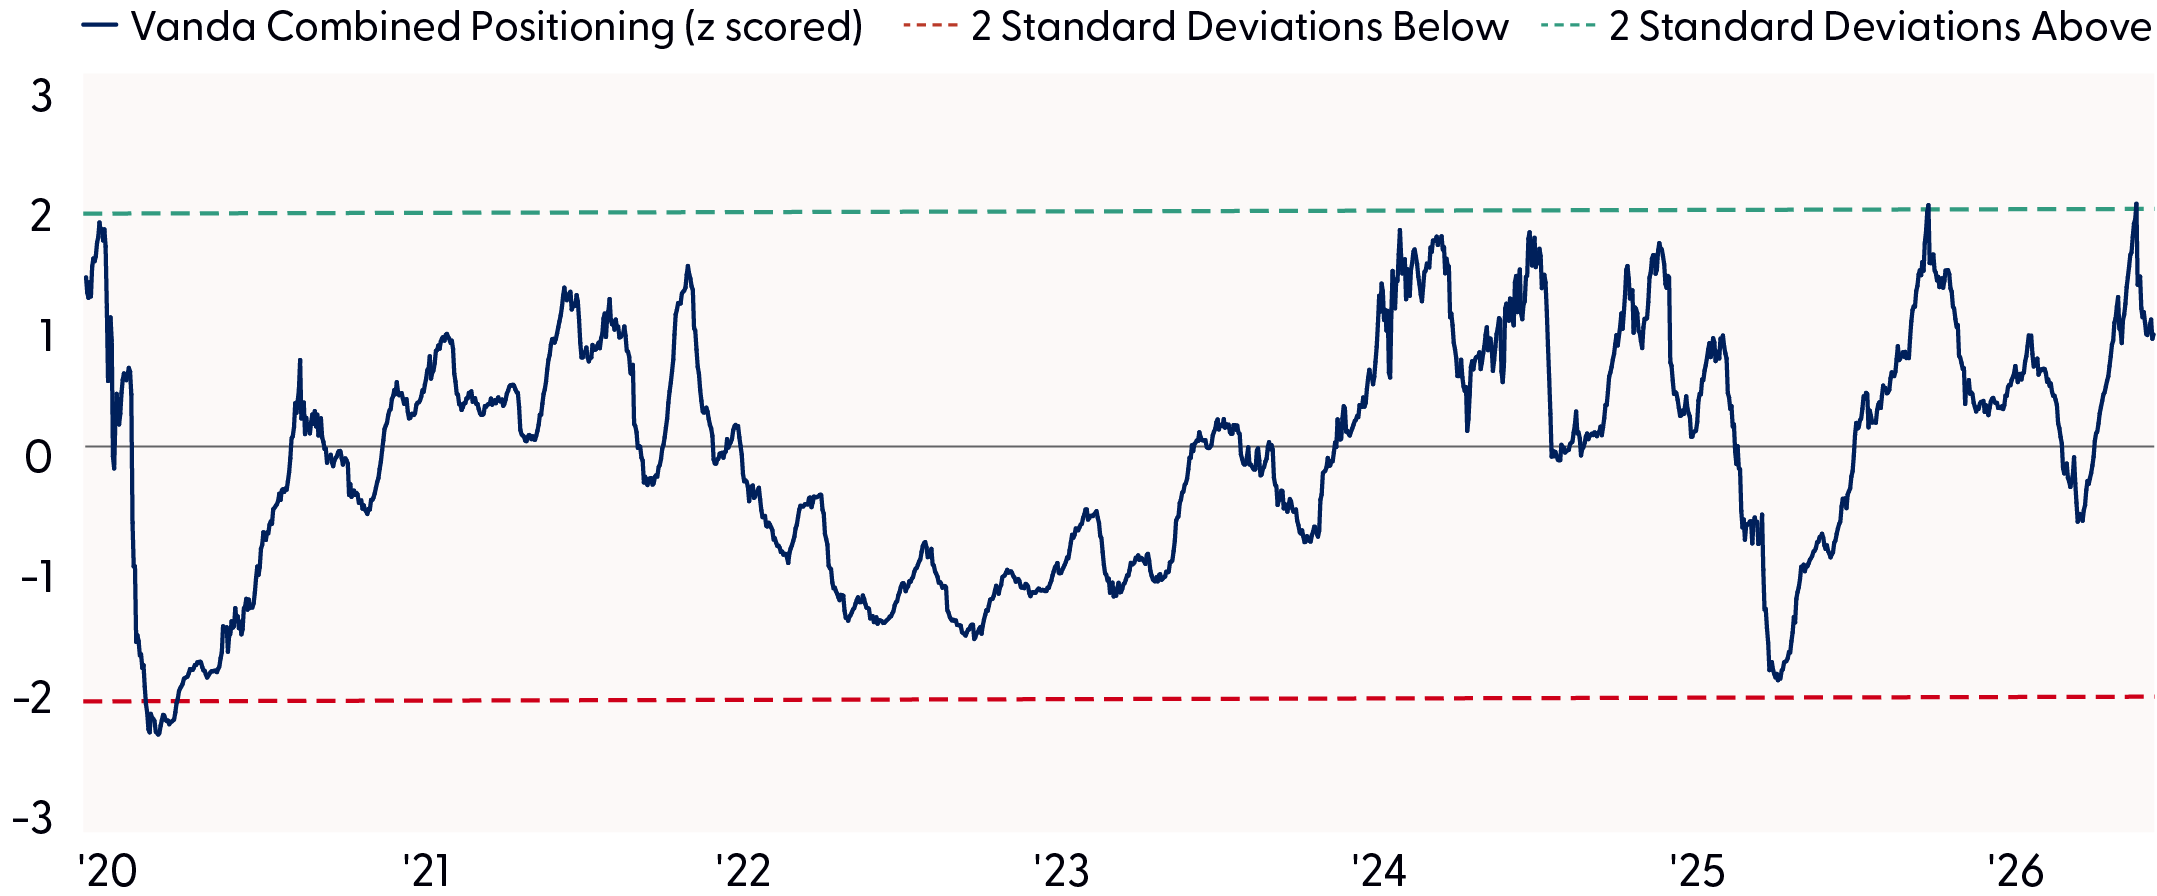
Source: LPL Research, Vanda, 06/25/26
Disclosures: Based on the volume weighted average investors’ positioning in US equities. The metric combines: Active mutual funds’ exposure, Long/short hedge funds’ net exposure, volatility targeting strategies, risk parity and CTAs’ net exposure as % of AUM to ES1, NQ1, FA1, RTY1, and DM1 futures. Institutional and retail investors’ net bullish positions in US single stock and ETF options (21 days rolling sum of OTM call – put US$ traded premium), as well as retail investors’ net purchases in US single stocks and ETFs. All the metrics are standardized and averaged. The mean and standard deviation used for the Z-score are calculated using the full history range for all metrics except for: Call to put indicators and retail net buying average and standard deviation are adjusted for pre and post-Covid as retail participation increased. Weights are based on estimated investors’ volumes as % of the total, we apply a cap to the maximum weight for each investor to avoid high levels of concentration.
Another Angle on Investor Sentiment: Margin Balances
At the same time, broader measures of risk appetite suggest that speculative leverage and optimism have risen meaningfully alongside the rally. Margin debt has ramped considerably this year, with FINRA reporting that debit balances in customers’ securities accounts reached a record $1.42 trillion last month. Over the last 12 months, margin debt has climbed 54%, representing nearly two standard deviations above the long-term average, an indication that investors are increasingly using borrowed money to participate in the advance.
Other sentiment gauges also point to elevated optimism. According to the Conference Board, the spread between consumers expecting stock prices to rise over the next six months versus those expecting a decline jumped to 30% in May, placing it in the 98th percentile over the last 30 years. Taken together, the data do not necessarily signal an imminent top is in the making, but they do suggest that expectations are high, positioning is crowded, and the market may be vulnerable to a reset if momentum begins to fade.
The Sharp Increase in Margin Debt is Another Indication of Stretched Positioning
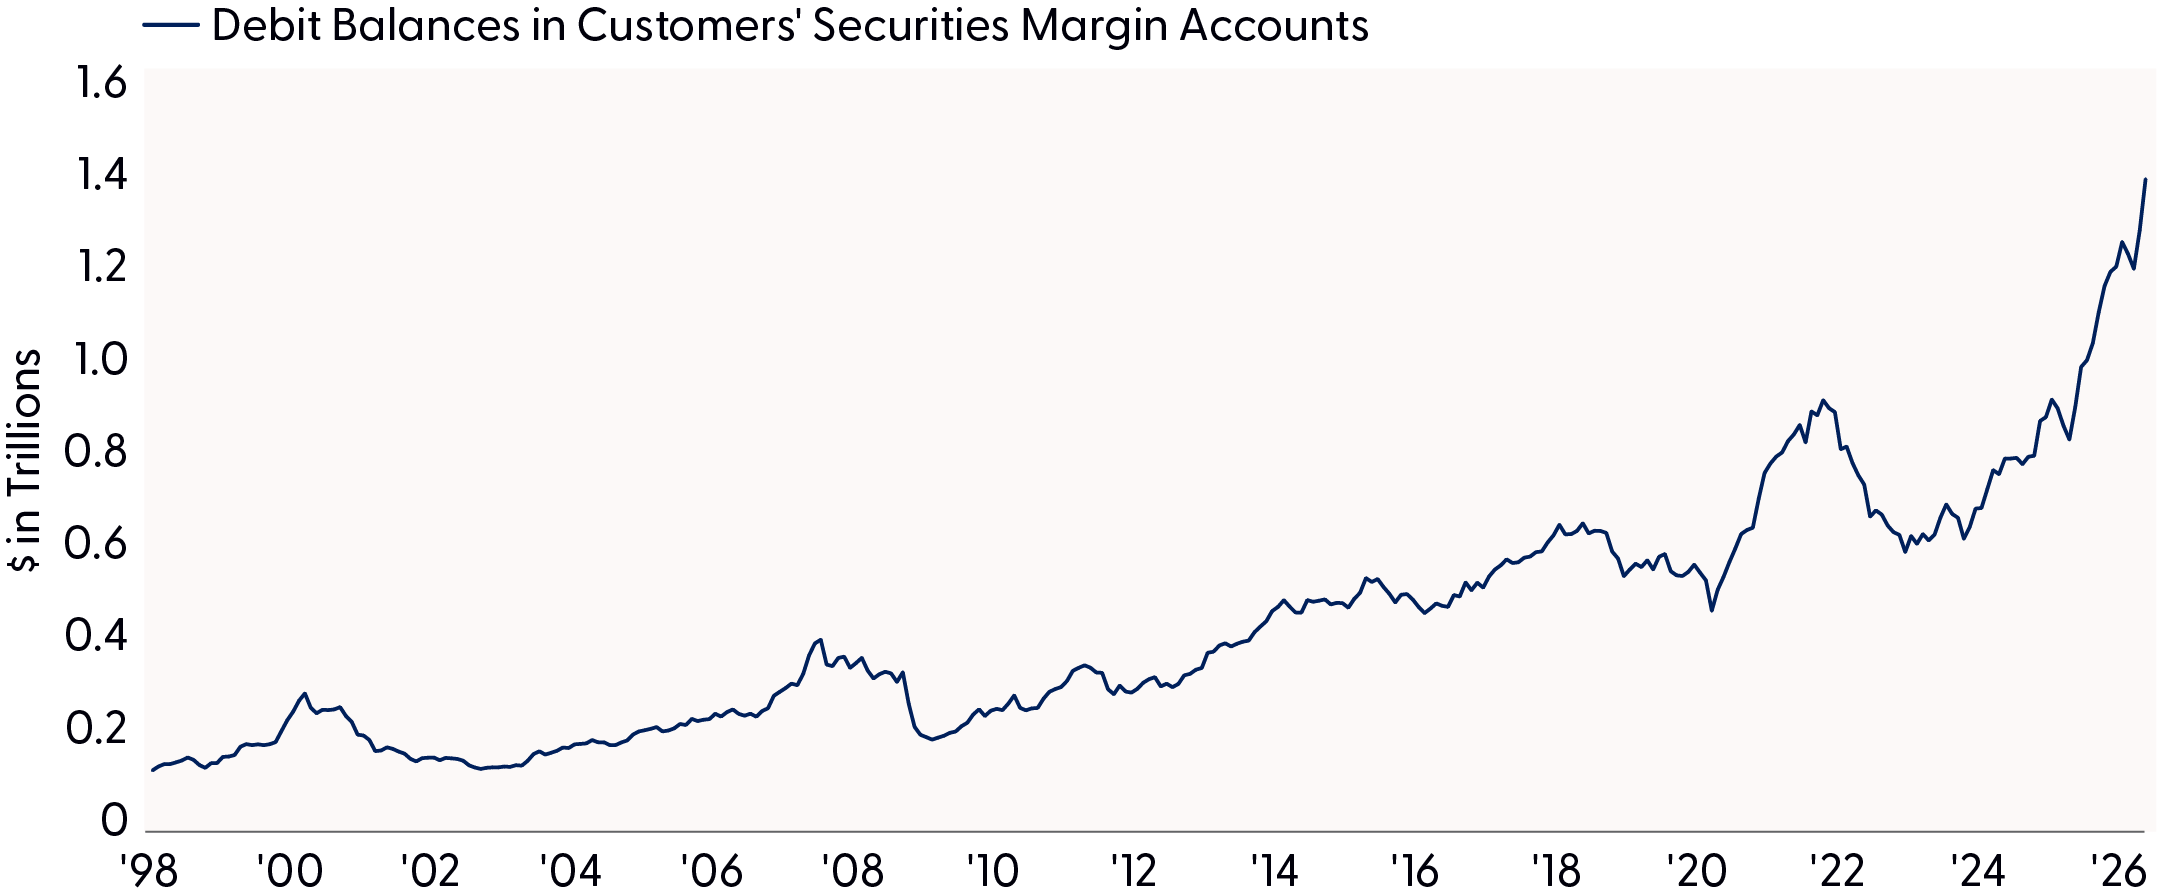
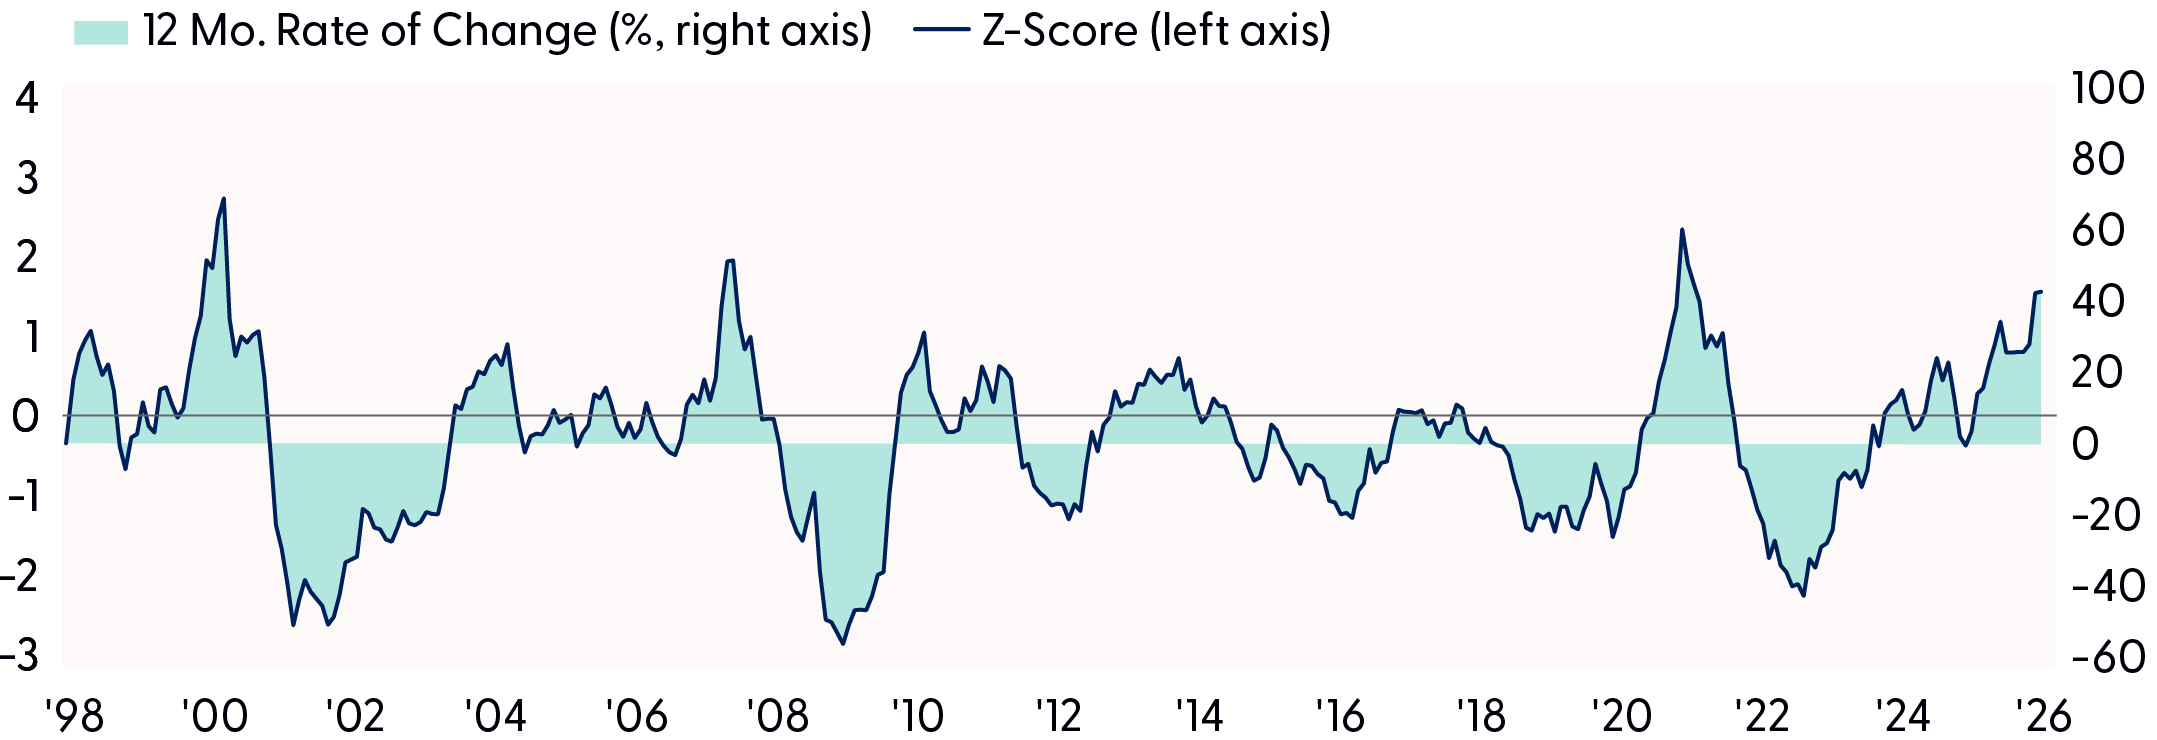
Source: LPL Research, Bloomberg, FINRA, 06/18/26
Disclosures: Data as of May 31, 2026. Past performance is no guarantee of future results. MA=moving average.
What About the Center of the AI Boom: Semiconductors
The Philadelphia Semiconductor Index (SOX) has become the epicenter of the artificial intelligence (AI) trade, capturing the market’s enthusiasm for the companies enabling the buildout of AI infrastructure. Its importance is hard to overstate; if AI is the dominant growth narrative in markets, semiconductors are the critical bottleneck and beneficiary. However, crowded positioning and increasingly euphoric sentiment have pushed the SOX to extremely overbought levels.
Importantly, overbought does not necessarily mean over. Momentum often begets momentum, and powerful trends can persist longer than investors expect. However, the mostly one-way price action over the last several months has created a more asymmetric risk/reward profile, because when parabolic advances finally end, the reversals tend to be dramatic and severe. This does not mean the AI or semiconductor trade is over but a cooling-off and/or profit-taking period could eventually create a healthy reset of overbought conditions and provide an attractive buying opportunity. The 12% drawdown for the SOX Index in early June offered a glimpse of what this process could look like.
One way to frame the current setup is through a rubber-band analogy: price has stretched far above its longer-term trend, represented by the 40-week moving average (wma), and while it can stretch further, history suggests it usually does not do so for long. On June 25, the SOX closed at a 64% premium to its 40-wma, a level reached only once before, during the late-cycle phase of the dot-com era. The index has also generated a 92.5% 12-week rate of change at a recent peak, an almost unprecedented surge over such a short window, rivaled again only by the late-cycle semiconductor melt-up in 2000. Bottom line, semiconductor stocks may be too far over their skis in the short term.
Conclusion
While stock market enthusiasm has increased, we do not believe it has crossed the threshold into outright irrational exuberance. Some sentiment surveys are stretched, but others remain near long-term averages; and positioning, although still elevated, has already begun to moderate from more extreme levels seen earlier in the quarter. That said, other indicators – including record margin debt and highly overbought conditions in key leadership groups like semiconductors – point to a market with an overly optimistic outlook.
In this environment, it’s important to distinguish between healthy optimism and excess. Strong fundamentals and powerful structural themes such as AI can justify elevated valuations for a while, but they do not eliminate the typical ups and downs. Rather than signaling the end of the bull market, current conditions appear more consistent with a mature bull market that may be due for a pause. Investors should remain disciplined, expect higher volatility, and be prepared for opportunities that often emerge when exuberance cools. Overall, the current investing landscape suggests durability beneath the surface, despite pockets of exuberance. We remain constructive on equities, recognizing that strong fundamentals can coexist with shorter-term risks as markets digest gains and adjust expectations.
Asset Allocation Insights
The LPL Research Strategic and Tactical Asset Allocation Committee (STAAC) maintains its recommendation for a tactical equity overweight, with emphasis on the U.S., and fixed income underweight. The Committee favors neutral style exposure as a result of stretched market positioning and technical indicators following the recent growth-led rally. As such, this view is expressed via a defensive factor tilt given our expectation for additional bouts of volatility until the macro backdrop improves further and the potential for market rotations away from the AI trade.
Within equity sectors, we hold an overweight stance toward the energy sector due to logistical challenges surrounding normalizing global oil flows. The STAAC places value on this hedge against potential additional Mideast flare ups. The Committee also recommends an overweight to industrials, supported by strong earnings momentum, favorable technicals, and continued tailwinds from fiscal spending and AI investment.
Important Disclosures
This material is for general information only and is not intended to provide specific advice or recommendations for any individual. There is no assurance that the views or strategies discussed are suitable for all investors or will yield positive outcomes. Investing involves risks including possible loss of principal. Any economic forecasts set forth may not develop as predicted and are subject to change.
References to markets, asset classes, and sectors are generally regarding the corresponding market index. Indexes are unmanaged statistical composites and cannot be invested into directly. Index performance is not indicative of the performance of any investment and do not reflect fees, expenses, or sales charges. All performance referenced is historical and is no guarantee of future results.
Any company names noted herein are for educational purposes only and not an indication of trading intent or a solicitation of their products or services. LPL Financial doesn’t provide research on individual equities.
All information is believed to be from reliable sources; however, LPL Financial makes no representation as to its completeness or accuracy.
All investing involves risk, including possible loss of principal.
US Treasuries may be considered “safe haven” investments but do carry some degree of risk including interest rate, credit, and market risk. Bonds are subject to market and interest rate risk if sold prior to maturity. Bond values will decline as interest rates rise and bonds are subject to availability and change in price.
The Standard & Poor’s 500 Index (S&P500) is a capitalization-weighted index of 500 stocks designed to measure performance of the broad domestic economy through changes in the aggregate market value of 500 stocks representing all major industries.
The PE ratio (price-to-earnings ratio) is a measure of the price paid for a share relative to the annual net income or profit earned by the firm per share. It is a financial ratio used for valuation: a higher PE ratio means that investors are paying more for each unit of net income, so the stock is more expensive compared to one with lower PE ratio.
Earnings per share (EPS) is the portion of a company’s profit allocated to each outstanding share of common stock. EPS serves as an indicator of a company’s profitability. Earnings per share is generally considered to be the single most important variable in determining a share’s price. It is also a major component used to calculate the price-to-earnings valuation ratio.
All index data from FactSet or Bloomberg. All index data from FactSet or Bloomberg.
This research material has been prepared by LPL Financial LLC.
Not Insured by FDIC/NCUA or Any Other Government Agency | Not Bank/Credit Union Guaranteed | Not Bank/Credit Union Deposits or Obligations| May Lose Value
For public use.
Member FINRA/SIPC.
RES-0007122-0526 | For Public Use | Tracking #1131697 (Exp. 06/2027)