We believe corporate America will follow up an outstanding second quarter earnings season with another good one in the third quarter. Support from a resilient economy, tariff mitigation measures, artificial intelligence (AI) investment, and currency should offset increasing tariff costs. With much of investors’ collective attention focused on the duration and economic impact of the government shutdown, and how to assess the outlook for the U.S. economy in the absence of government data, writing about something else this week is a nice diversion.
Don’t Expect Much Suspense This Quarter
Earnings season is usually predictable quarter to quarter in the absence of economic inflection points. We would suggest the second quarter was more of an inflection point than the third as tariffs ramped up in a meaningful way and companies’ visibility into tariff costs improved. The effective tariff rate ended July at 9.7%, up slightly from below 9% at the end of June (source: Bloomberg). We think another three to five points of tariffs will likely be added on to July levels to land at an overall rate between 12% to 14%, but the Supreme Court will determine how quickly we get there. The nation’s highest court is expected to rule on the legality of the Trump administration’s tariffs imposed under the International Economic Emergency Powers Act (IEEPA) within the next few months.
So, with less suspense around tariffs, economic growth that could approach 3% for Q3, the continued surge in artificial intelligence (AI) investment, and a roughly 5% drop in the average level of the U.S. dollar from the prior year quarter, corporate America has an excellent opportunity to post another low-teens earnings growth rate for the S&P 500. The 8% upside produced last quarter may be too much to ask for, but a 5% beat seems like a reasonable expectation.
Tariff-Driven Slowdown Unlikely to Hurt Q3 Earnings Growth Much
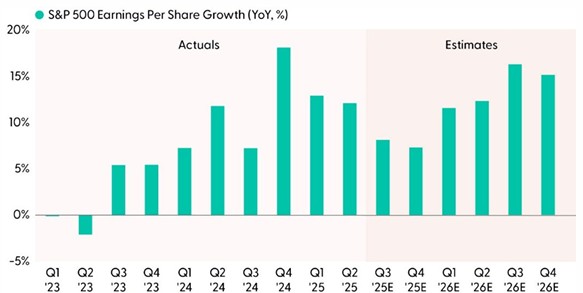
Source: LPL Research, FactSet, 10/02/25
Disclosures: All indexes are unmanaged and cannot be invested in directly. Past performance is no guarantee of future results. Estimates may not materialize as predicted and are subject to change.
Artificial Intelligence Capital Investment Remains the Dominant Driver
The Magnificent Seven will again be a significant driver of earnings growth in the third quarter. In fact, 70% of the 8% expected S&P 500 earnings growth reflected in analysts’ estimates is coming from the biggest six technology companies (the Magnificent Seven minus Tesla). It’s remarkable that companies this big can grow earnings 40–50% — but several hundred billion in capital spending annually will do that!
As shown in the “Magnificent Seven Remains a Powerful Earnings Driver” chart, this group continues to dominate the earnings growth of the rest of the companies in the index. While this trend will likely continue through year-end, it is expected to narrow next year as the S&P 493 (the S&P 500 excluding the Magnificent Seven) plays some catch up.
This earnings growth gap is still big right now and underpins LPL Research’s continued preference for large growth equities over their large value counterparts. But, as the gap narrows in 2026, we would expect this bull market to broaden out. Cyclical value stocks may get some additional support from the fiscal stimulus provided by the One Big Beautiful Bill Act (OBBBA). LPL Research’s positive view of financials fits this theme, but industrials are another potential beneficiary.
Magnificent Seven Remains a Powerful Earnings Driver
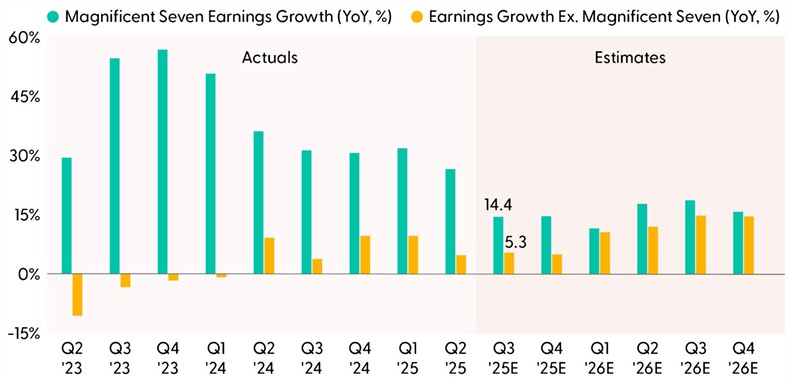
Source: LPL Research, Bloomberg, 10/02/25
Disclosures: Indexes are unmanaged and cannot be invested in directly. Past performance is no guarantee of future results. Estimates may not materialize as predicted and are subject to change. Magnificent Seven includes Alphabet (GOOG/L), Amazon (AMZN), Apple (AAPL), Meta (META), Microsoft (MSFT), NVIDIA (NVDA), and Tesla (TSLA).
Margin Outlook: Where Are Tariff Effects?
Tariff effects were expected to show up in second quarter earnings reported in July and August. Well, they certainly showed up for some global industries, such as automakers, industrial equipment makers, and apparel retailers. But at the macro level, the effects have been much less than we, and most analysts, anticipated. There are a lot of reasons for this, including:
- Some tariffs haven’t gone into effect yet.
- Some service industries are largely unaffected.
- AI-driven productivity enhancements are starting to show up, supporting profit margins, while most AI companies have moderate tariff exposure.
- Several key companies have struck side deals by committing to investing in the U.S. or furthering other Trump administration objectives. Apple (AAPL), Intel (INTC), Pfizer (PFE), and Taiwan Semiconductor (TSM) are among the biggest names.
- Most imports from Canada and Mexico are subject to lower tariffs under the USMCA trade agreement.
- Tariff costs have been spread out among exporters, importers, and consumers, reducing the hit to profit margins.
More margin pressure is likely coming as more of these tariffs flow through in the next few months. However, based on analysts’ earnings estimates, Wall Street sure isn’t worried. The “Corporate America Managing Large — But Lesser — Tariff Burden Very Well” chart reflects expectations that margins will continue to expand. Given the recent track record, we won’t bet against corporate America expanding margins, though we do not expect quite as much expansion as is reflected in analysts’ consensus estimates.
Corporate America Managing Large — But Lesser — Tariff Burden Very Well
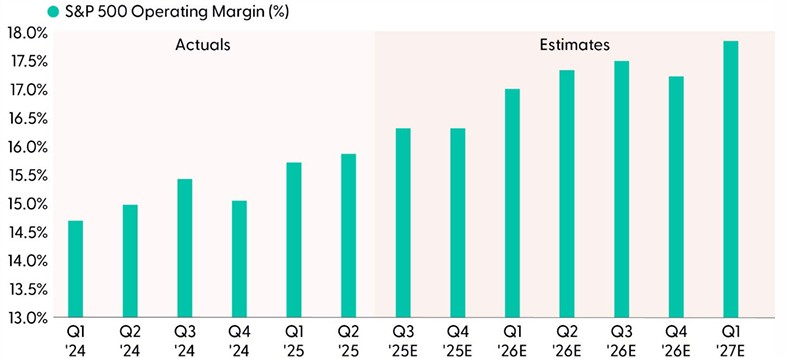
Source: LPL Research, Bloomberg 10/02/25
Disclosures: Indexes are unmanaged and cannot be invested in directly. Past performance is no guarantee of future results. Estimates may not materialize as predicted and are subject to change.
Reasons For Optimism on Earnings In 2026
We anticipate corporate America to benefit from steady economic growth next year, supporting solid earnings growth. Fiscal stimulus from the OBBBA is expected to jump start growth after a late 2025 slowdown. We expect companies to continue to manage tariffs effectively. The dollars going into the AI investment surge are only going to get bigger next year, driving strong technology sector earnings gains. And another year means companies will have more time to generate productivity gains from AI, supporting margins. The recent increase in earnings estimates is encouraging (in the “Earnings Estimates Have Impressively Risen Lately” chart). Finally, share buybacks are expected to maintain or exceed their record pace set this year, depressing the denominator in the earnings per share (EPS) calculation and lifting EPS.
Put all that together and a 10% increase in S&P 500 profits in 2026 is a real possibility. That puts $290 per share in play for index EPS next year, compared to the $280-plus range we cited in our second quarter earnings recap commentary. While a higher price-to-earnings ratio would be a tough ask, earnings may do the work for us and keep this bull market well supported through 2026
Earnings Estimates Have Impressively Risen Lately
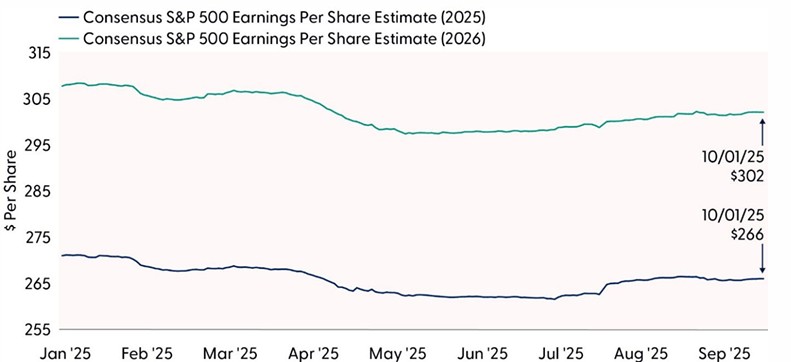
Source: LPL Research, Bloomberg, 10/02/25
Disclosures: Indexes are unmanaged and cannot be invested in directly. Past performance is no guarantee of future results. Estimates may not materialize as predicted and are subject to change.
Conclusion
In our view, we believe corporate America should continue to deliver solid earnings growth in the third quarter with few surprises. Given the solid economic backdrop, resilient earnings estimate trends, the tailwind of AI capital investment, and a weak U.S. dollar, it’s very likely earnings will deliver another 5–7% upside to current consensus estimates and grow earnings at a low-teens pace in Q3. It won’t be easy, however, because companies had to absorb more tariff costs last quarter compared with Q2.
Looking ahead, the combination of AI investment, tech-driven productivity gains, and supportive fiscal policy could potentially enable earnings to grow at a double-digit clip in 2026 and keep this bull market well supported.
Asset Allocation Insights
LPL’s Strategic and Tactical Asset Allocation Committee (STAAC) maintains its tactical neutral stance on equities. Investors may be well served by bracing for occasional bouts of volatility given how much optimism is reflected in stock valuations, lingering tariff and inflation risks. STAAC’s regional preferences across the U.S., developed international, and emerging markets (EM) are aligned with benchmarks. The Committee still favors growth over value, large caps over small caps, and the communication services and financials sectors.
Within fixed income, the STAAC holds a neutral weight in core bonds, with a slight preference for mortgage-backed securities (MBS) over investment-grade corporates. The Committee believes the risk-reward for core bond sectors (U.S. Treasury, agency MBS, investment-grade corporates) is more attractive than plus sectors. The Committee does not believe adding duration (interest rate sensitivity) at current levels is attractive and remains neutral relative to benchmarks.
Important Disclosures
This material is for general information only and is not intended to provide specific advice or recommendations for any individual. There is no assurance that the views or strategies discussed are suitable for all investors or will yield positive outcomes. Investing involves risks including possible loss of principal. Any economic forecasts set forth may not develop as predicted and are subject to change.
References to markets, asset classes, and sectors are generally regarding the corresponding market index. Indexes are unmanaged statistical composites and cannot be invested into directly. Index performance is not indicative of the performance of any investment and do not reflect fees, expenses, or sales charges. All performance referenced is historical and is no guarantee of future results.
Any company names noted herein are for educational purposes only and not an indication of trading intent or a solicitation of their products or services. LPL Financial doesn’t provide research on individual equities.
All information is believed to be from reliable sources; however, LPL Financial makes no representation as to its completeness or accuracy.
All investing involves risk, including possible loss of principal.
US Treasuries may be considered “safe haven” investments but do carry some degree of risk including interest rate, credit, and market risk. Bonds are subject to market and interest rate risk if sold prior to maturity. Bond values will decline as interest rates rise and bonds are subject to availability and change in price.
The Standard & Poor’s 500 Index (S&P500) is a capitalization-weighted index of 500 stocks designed to measure performance of the broad domestic economy through changes in the aggregate market value of 500 stocks representing all major industries.
The PE ratio (price-to-earnings ratio) is a measure of the price paid for a share relative to the annual net income or profit earned by the firm per share. It is a financial ratio used for valuation: a higher PE ratio means that investors are paying more for each unit of net income, so the stock is more expensive compared to one with lower PE ratio.
Earnings per share (EPS) is the portion of a company’s profit allocated to each outstanding share of common stock. EPS serves as an indicator of a company’s profitability. Earnings per share is generally considered to be the single most important variable in determining a share’s price. It is also a major component used to calculate the price-to-earnings valuation ratio.
All index data from FactSet or Bloomberg.
This research material has been prepared by LPL Financial LLC.
Not Insured by FDIC/NCUA or Any Other Government Agency | Not Bank/Credit Union Guaranteed | Not Bank/Credit Union Deposits or Obligations | May Lose Value
For public use.
Member FINRA/SIPC.
RES-0006007-0925 Tracking #805869 | #805870 (Exp. 10/26)
Q3 Earnings Season Preview: Little Suspense | Weekly Market Commentary | October 6, 2025
We believe corporate America will follow up an outstanding second quarter earnings season with another good one in the third quarter. Support from a resilient economy, tariff mitigation measures, artificial intelligence (AI) investment, and currency should offset increasing tariff costs. With much of investors’ collective attention focused on the duration and economic impact of the government shutdown, and how to assess the outlook for the U.S. economy in the absence of government data, writing about something else this week is a nice diversion.
Don’t Expect Much Suspense This Quarter
Earnings season is usually predictable quarter to quarter in the absence of economic inflection points. We would suggest the second quarter was more of an inflection point than the third as tariffs ramped up in a meaningful way and companies’ visibility into tariff costs improved. The effective tariff rate ended July at 9.7%, up slightly from below 9% at the end of June (source: Bloomberg). We think another three to five points of tariffs will likely be added on to July levels to land at an overall rate between 12% to 14%, but the Supreme Court will determine how quickly we get there. The nation’s highest court is expected to rule on the legality of the Trump administration’s tariffs imposed under the International Economic Emergency Powers Act (IEEPA) within the next few months.
So, with less suspense around tariffs, economic growth that could approach 3% for Q3, the continued surge in artificial intelligence (AI) investment, and a roughly 5% drop in the average level of the U.S. dollar from the prior year quarter, corporate America has an excellent opportunity to post another low-teens earnings growth rate for the S&P 500. The 8% upside produced last quarter may be too much to ask for, but a 5% beat seems like a reasonable expectation.
Tariff-Driven Slowdown Unlikely to Hurt Q3 Earnings Growth Much
Source: LPL Research, FactSet, 10/02/25
Disclosures: All indexes are unmanaged and cannot be invested in directly. Past performance is no guarantee of future results. Estimates may not materialize as predicted and are subject to change.
Artificial Intelligence Capital Investment Remains the Dominant Driver
The Magnificent Seven will again be a significant driver of earnings growth in the third quarter. In fact, 70% of the 8% expected S&P 500 earnings growth reflected in analysts’ estimates is coming from the biggest six technology companies (the Magnificent Seven minus Tesla). It’s remarkable that companies this big can grow earnings 40–50% — but several hundred billion in capital spending annually will do that!
As shown in the “Magnificent Seven Remains a Powerful Earnings Driver” chart, this group continues to dominate the earnings growth of the rest of the companies in the index. While this trend will likely continue through year-end, it is expected to narrow next year as the S&P 493 (the S&P 500 excluding the Magnificent Seven) plays some catch up.
This earnings growth gap is still big right now and underpins LPL Research’s continued preference for large growth equities over their large value counterparts. But, as the gap narrows in 2026, we would expect this bull market to broaden out. Cyclical value stocks may get some additional support from the fiscal stimulus provided by the One Big Beautiful Bill Act (OBBBA). LPL Research’s positive view of financials fits this theme, but industrials are another potential beneficiary.
Magnificent Seven Remains a Powerful Earnings Driver
Source: LPL Research, Bloomberg, 10/02/25
Disclosures: Indexes are unmanaged and cannot be invested in directly. Past performance is no guarantee of future results. Estimates may not materialize as predicted and are subject to change. Magnificent Seven includes Alphabet (GOOG/L), Amazon (AMZN), Apple (AAPL), Meta (META), Microsoft (MSFT), NVIDIA (NVDA), and Tesla (TSLA).
Margin Outlook: Where Are Tariff Effects?
Tariff effects were expected to show up in second quarter earnings reported in July and August. Well, they certainly showed up for some global industries, such as automakers, industrial equipment makers, and apparel retailers. But at the macro level, the effects have been much less than we, and most analysts, anticipated. There are a lot of reasons for this, including:
More margin pressure is likely coming as more of these tariffs flow through in the next few months. However, based on analysts’ earnings estimates, Wall Street sure isn’t worried. The “Corporate America Managing Large — But Lesser — Tariff Burden Very Well” chart reflects expectations that margins will continue to expand. Given the recent track record, we won’t bet against corporate America expanding margins, though we do not expect quite as much expansion as is reflected in analysts’ consensus estimates.
Corporate America Managing Large — But Lesser — Tariff Burden Very Well
Source: LPL Research, Bloomberg 10/02/25
Disclosures: Indexes are unmanaged and cannot be invested in directly. Past performance is no guarantee of future results. Estimates may not materialize as predicted and are subject to change.
Reasons For Optimism on Earnings In 2026
We anticipate corporate America to benefit from steady economic growth next year, supporting solid earnings growth. Fiscal stimulus from the OBBBA is expected to jump start growth after a late 2025 slowdown. We expect companies to continue to manage tariffs effectively. The dollars going into the AI investment surge are only going to get bigger next year, driving strong technology sector earnings gains. And another year means companies will have more time to generate productivity gains from AI, supporting margins. The recent increase in earnings estimates is encouraging (in the “Earnings Estimates Have Impressively Risen Lately” chart). Finally, share buybacks are expected to maintain or exceed their record pace set this year, depressing the denominator in the earnings per share (EPS) calculation and lifting EPS.
Put all that together and a 10% increase in S&P 500 profits in 2026 is a real possibility. That puts $290 per share in play for index EPS next year, compared to the $280-plus range we cited in our second quarter earnings recap commentary. While a higher price-to-earnings ratio would be a tough ask, earnings may do the work for us and keep this bull market well supported through 2026
Earnings Estimates Have Impressively Risen Lately
Source: LPL Research, Bloomberg, 10/02/25
Disclosures: Indexes are unmanaged and cannot be invested in directly. Past performance is no guarantee of future results. Estimates may not materialize as predicted and are subject to change.
Conclusion
In our view, we believe corporate America should continue to deliver solid earnings growth in the third quarter with few surprises. Given the solid economic backdrop, resilient earnings estimate trends, the tailwind of AI capital investment, and a weak U.S. dollar, it’s very likely earnings will deliver another 5–7% upside to current consensus estimates and grow earnings at a low-teens pace in Q3. It won’t be easy, however, because companies had to absorb more tariff costs last quarter compared with Q2.
Looking ahead, the combination of AI investment, tech-driven productivity gains, and supportive fiscal policy could potentially enable earnings to grow at a double-digit clip in 2026 and keep this bull market well supported.
Asset Allocation Insights
LPL’s Strategic and Tactical Asset Allocation Committee (STAAC) maintains its tactical neutral stance on equities. Investors may be well served by bracing for occasional bouts of volatility given how much optimism is reflected in stock valuations, lingering tariff and inflation risks. STAAC’s regional preferences across the U.S., developed international, and emerging markets (EM) are aligned with benchmarks. The Committee still favors growth over value, large caps over small caps, and the communication services and financials sectors.
Within fixed income, the STAAC holds a neutral weight in core bonds, with a slight preference for mortgage-backed securities (MBS) over investment-grade corporates. The Committee believes the risk-reward for core bond sectors (U.S. Treasury, agency MBS, investment-grade corporates) is more attractive than plus sectors. The Committee does not believe adding duration (interest rate sensitivity) at current levels is attractive and remains neutral relative to benchmarks.
Important Disclosures
This material is for general information only and is not intended to provide specific advice or recommendations for any individual. There is no assurance that the views or strategies discussed are suitable for all investors or will yield positive outcomes. Investing involves risks including possible loss of principal. Any economic forecasts set forth may not develop as predicted and are subject to change.
References to markets, asset classes, and sectors are generally regarding the corresponding market index. Indexes are unmanaged statistical composites and cannot be invested into directly. Index performance is not indicative of the performance of any investment and do not reflect fees, expenses, or sales charges. All performance referenced is historical and is no guarantee of future results.
Any company names noted herein are for educational purposes only and not an indication of trading intent or a solicitation of their products or services. LPL Financial doesn’t provide research on individual equities.
All information is believed to be from reliable sources; however, LPL Financial makes no representation as to its completeness or accuracy.
All investing involves risk, including possible loss of principal.
US Treasuries may be considered “safe haven” investments but do carry some degree of risk including interest rate, credit, and market risk. Bonds are subject to market and interest rate risk if sold prior to maturity. Bond values will decline as interest rates rise and bonds are subject to availability and change in price.
The Standard & Poor’s 500 Index (S&P500) is a capitalization-weighted index of 500 stocks designed to measure performance of the broad domestic economy through changes in the aggregate market value of 500 stocks representing all major industries.
The PE ratio (price-to-earnings ratio) is a measure of the price paid for a share relative to the annual net income or profit earned by the firm per share. It is a financial ratio used for valuation: a higher PE ratio means that investors are paying more for each unit of net income, so the stock is more expensive compared to one with lower PE ratio.
Earnings per share (EPS) is the portion of a company’s profit allocated to each outstanding share of common stock. EPS serves as an indicator of a company’s profitability. Earnings per share is generally considered to be the single most important variable in determining a share’s price. It is also a major component used to calculate the price-to-earnings valuation ratio.
All index data from FactSet or Bloomberg.
This research material has been prepared by LPL Financial LLC.
Not Insured by FDIC/NCUA or Any Other Government Agency | Not Bank/Credit Union Guaranteed | Not Bank/Credit Union Deposits or Obligations | May Lose Value
For public use.
Member FINRA/SIPC.
RES-0006007-0925 Tracking #805869 | #805870 (Exp. 10/26)
Recent Posts
Categories
SIGN UP TO RECEIVE OUR WEEKLY NEWSLETTER
Sign up to get interesting news and updates delivered to your inbox.