The “American Industrial Renaissance” is an investment theme investors and allocators alike have probably been pitched several times, or at the very least heard about. Supply chains for manufactured goods have evolved to become more complex, while U.S. manufacturing employment as a share of total employment has steadily declined, leaving policy makers to grapple with the ramifications of a shrinking manufacturing base. Facing effects ranging from structural employment shifts to fragile supply chains to national security, over the last decade, Washington has been both vocal and active about bringing manufacturing back stateside.
This has left investors to explore if we’re actually seeing an “American Industrial Renaissance.” If so, what forces are driving it, and what economic indicators can markets turn to in order to confirm (or deny) it? In this edition of the Weekly Market Commentary, we set out to provide some clarity.
Domestic Manufacturing Comeback: Renaissance or Rhetoric?
The narrative of the “hollowing out” of American manufacturing is well-known, and perhaps just as well-known is the narrative around a coming “manufacturing renaissance” in the U.S. After four decades of globalization, manufacturing employment in the U.S. as a share of total employment has steadily decreased, from over 20% in 1980 to below 8% in 2025. The decline was driven by a trade shift in the 1980s followed by a productivity boom in the 1990s. Another major factor behind the shrinking manufacturing sector is the natural progression of economic development. As economies mature, growth increasingly shifts toward services, while agriculture and manufacturing account for smaller shares of overall activity.
We’ve seen this across all major global economies. But that doesn’t mean the manufacturing sector loses importance over time, so let’s dig deeper into what a manufacturing renaissance would be like.
While domestic manufacturers have faced competition from imports since as early as the 1970s, we key in on the 1980s as a marker for the start of the globalization and outsourcing trend due to several global macroeconomic shifts, including normalizing trade relations with China via “most favored nation” (MFN) tariff designation in 1980; the 1985 Plaza Accord driving Japanese supply chains to lower labor costs regions in Asia; and China’s own internal market reforms and the launching (and expanding) of special economic zones.
China’s eventual admission into the World Trade Organization (WTO) in 2001 serves as an accelerator of the trend, rather than the start. The reduction in manufacturing employment hit certain regions of the U.S. harder than others, and this naturally led politicians representing these areas of the country (as well as presidential candidates seeking electoral votes from said states) to lament globalization and the jobs and livelihoods it “stole.” Catchy campaign slogans and unrealistic promises followed, reaching a crescendo with Donald Trump’s first election in 2016. However, we are primarily interested in the market and societal forces that could drive a meaningful return of U.S. manufacturing, and what indicators should we track to understand if this inflection is in fact taking place.
Like rising literacy rates and the printing press pre-dating the Scientific Revolution, or coal-burning energy and the invention of the steam engine during the Industrial Revolution, every renaissance requires the convergence of multiple societal tailwinds. Hyperbole aside, if we are in fact experiencing an American industrial renaissance, we should be able to identify these societal forces converging. We have identified three such forces: 1) supply-chain resilience, 2) industrial policy with (mostly) bipartisan support, and 3) domestic energy production as a competitive advantage.
Supply Chain Resilience, De-Globalization, and Reshoring
Despite excitement around increased domestic industrial activity, global trade remains resilient, with imports compounding at about 5% annually over the last decade. However, the supply chain disruptions that surfaced during COVID-19, as well as continued geopolitical upheavals, have put a renewed focus on building greater resilience into supply chains and ensuring self-reliance for key high-value industries and materials.
Investors should be careful not to confuse a selective industrial realignment with wholesale deglobalization. The broad data does not support a collapse in global trade, but underscores the fact that cross-border commerce remains highly connected. What we are seeing are specific shifts among trading partners and increased investment domestically. As shown in the “Imports from China Now Below ~9% as Mexico, Vietnam, and Taiwan Gain Share” chart below, U.S. concentration to Chinese imports has fallen materially, while Mexico, Vietnam, and Taiwan collectively have gained share in the same period. At the same time, annualized U.S. private manufacturing construction spending has surged from roughly $75 billion in early 2021 to roughly $200 billion by early 2026. Notably, shown in the Manufacturing Capacity in the U.S. Has Expanded for 51 Months Straight” chart below, manufacturing capacity in the U.S. has seen month-over-month increases for 51 straight months, going back to early 2022, with the largest contributions coming from computer products and electrical equipment. Although the improvement is significant, the sector has plenty of room to go before it reaches the production heights of the early 2000s. What is also noteworthy is the manufacturing of tech equipment in the 1980s and 1990s set the economy up for a massive regime shift in what and how we manufacture. We view all of these indicators as evidence that at least part of the realignment is moving beyond headlines and into physical domestic capacity formation, which warrants monitoring by investors to confirm (or deny) the American industrial renaissance thesis.
That said, we do not intend to overstate the domestic content of the shift. Nearshoring improves resilience relative to China’s concentration, but it is not the same as a U.S. manufacturing renaissance, and some rerouting may still embed meaningful Chinese-origin content. The better way to define the opportunity is as a concentrated buildout in strategic sectors, such as computer and electronics, electrical equipment, and transportation (evidenced by 88% of 2024 reshoring jobs being in the tech space, per the Reshoring Initiatives 2024 Annual Report). However, we remain cautious of making any grand assumptions around manufacturing employment growth coinciding at a similar trend as spending growth due to the nature of modern high-tech manufacturing (greater use of autonomous processes and robotics), not to mention the minimal employment levels required to run a data center once construction is complete.
Imports from China Now Below ~9% as Mexico, Vietnam, and Taiwan Gain Share
Percent of imports from China, Mexico, Vietnam, and Taiwan, 2017-Trailing 12 Months to Feb 2026 (TTM)
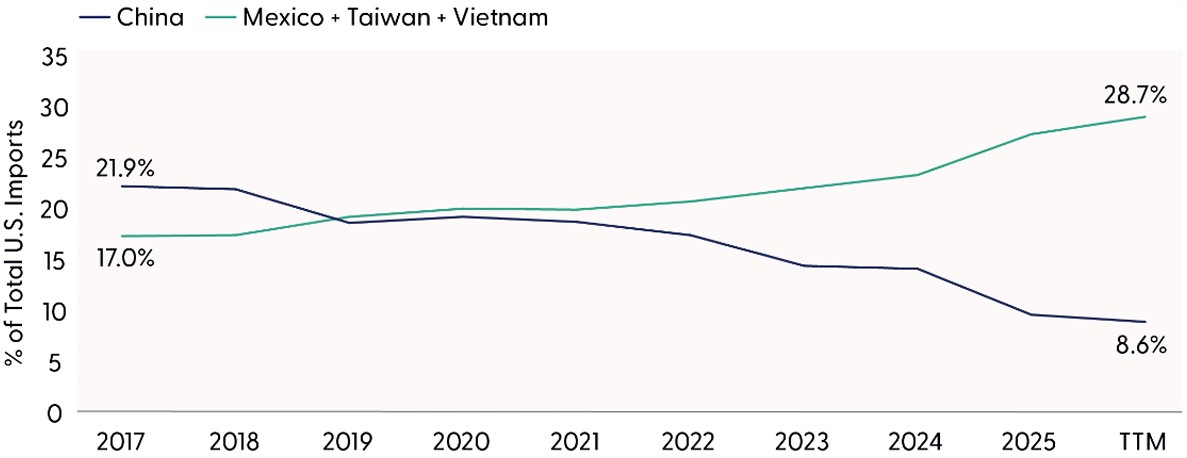
Source: LPL Research, Bloomberg, U.S. Census Bureau 04/21/26
Disclosures: Past performance is no guarantee of future results.
Manufacturing Capacity in the U.S. Has Expanded for 51 Months Straight
U.S. manufacturing capacity and production, seasonally adjusted index (2017 = 100), Dec 2021 – Mar 2026
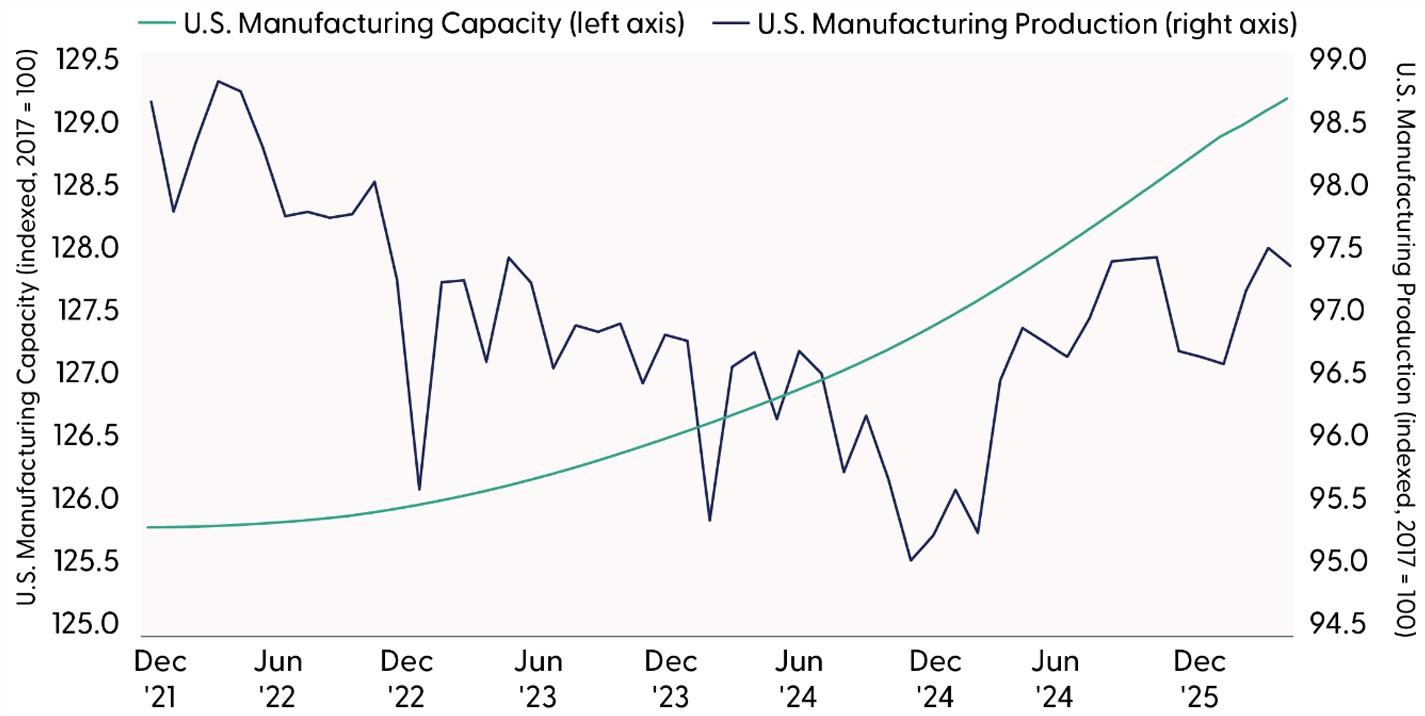
Source: LPL Research, Bloomberg, U.S. Federal Reserve 04/21/26
Disclosures: Past performance is no guarantee of future results.
Policy Serving as a Tailwind to Renaissance
The second identified force supporting the manufacturing renaissance theme is U.S. industrial policy. Proposals and promises for domestic industrial and infrastructure investment are frequently made by politicians on the campaign trail, so it is important to verify whether such proposals are showing up in the data. The last two presidential administrations seem to have had success with their respective policy programs, providing policy support for an American industrial renaissance that is unusually broad and durable.
Biden-era subsidies, tax credits, and infrastructure appropriations created the demand signal, while Trump 2.0 tariffs and domestic-content pressure are raising the cost of producing offshore. While the two administrations’ means certainly differ, the ends are similar. And because the ends are similar, they enjoy broad bipartisan support (despite party-line congressional vote counts). The combination of each administration’s approach is more powerful than either tool alone, and it helps explain why U.S. manufacturing construction spending inflected so sharply after 2021, alongside massive monetary policy support. The Infrastructure Investment and Jobs Act (IIJA), signed November 15, 2021, the August 2022-signed CHIPS (Creating Helpful Incentives to Produce Semiconductors) and Science Act, and the Inflation Reduction Act, signed August 16, 2022, together helped catalyze a visible step-up in domestic manufacturing construction.
The second layer of support has come from a more protectionist trade regime. Starting with the January 20, 2025 “America First Trade Policy” memorandum, followed by expanded steel and aluminum tariffs, 25% tariffs on imported autos, and additional tariff actions and investigations across semiconductors, copper, and critical minerals, the policy mix has increasingly favored domestic production and North American supply chain localization. However, we note that while tariffs can support domestic volume and pricing, they also raise input costs for manufacturers that remain dependent on imported components. In other words, industrial policy is a tailwind for the build cycle, but not every industrial company is equally positioned to convert that tailwind into profit growth.
Energy Independence as a Competitive Advantage
The third and final structural force that is supportive of the American industrial renaissance is energy. Geopolitics, war, and trade disputes all contribute to this dynamic, and we won’t suggest it will last forever. But the fact remains that the U.S. has abundant natural gas resources and refining capacity, providing businesses with lower input costs relative to peer countries.
Among the structural supports for an American industrial renaissance, energy may be the most tangible. The shale era gave U.S. industry a genuine input-cost advantage, as looking back over the last three years (excluding recent price spikes from the Iran war), the European premium to domestic natural gas averaged about 175%, while Japan/Korea liquid natural gas (LNG) prices averaged a premium of about 200%. Electricity tells a similar story, with EU industrial power prices for energy-intensive users still running at roughly twice U.S. levels in 2025. For energy intensive industries (such as chemicals, steel, aluminum, fertilizers, and semiconductors), this is a real cost-of production edge that supports the competitiveness of U.S.-based manufacturing.
The important caveat is that this advantage may narrow at the margin as domestic demand rises. U.S. natural gas production hit record highs last year, but expanding LNG exports and rising electricity demand from data centers are beginning to tighten the domestic balance. The U.S. Energy Information Administration (EIA) sees Henry Hub rising to about $4.30/MMBtu in 2026, and some longer-range industry forecasts envision U.S. gas prices nearer $5/MMBtu in the early 2030s as export capacity and AI-related power demand grow. As for what the commodity markets are currently pricing in, the futures curve for their respective natural gas benchmarks shows the average premium for EU/Asia natural gas prices compared to domestic prices to compress from 175–200% to 20–70%. Therefore, we would not suggest that U.S. energy is going to be cheaper forever but has a meaningful cost advantage today (and a likely less meaningful but still present cost advantage in the near future), and domestic manufacturing companies benefit from that advantage relative to their foreign peers.
U.S. Industry Benefits from Cheaper Energy, Net Energy Exporter Status
Natural gas benchmark prices, U.S., Europe, and Japan (converted to USD / million Btu (MMBTU))
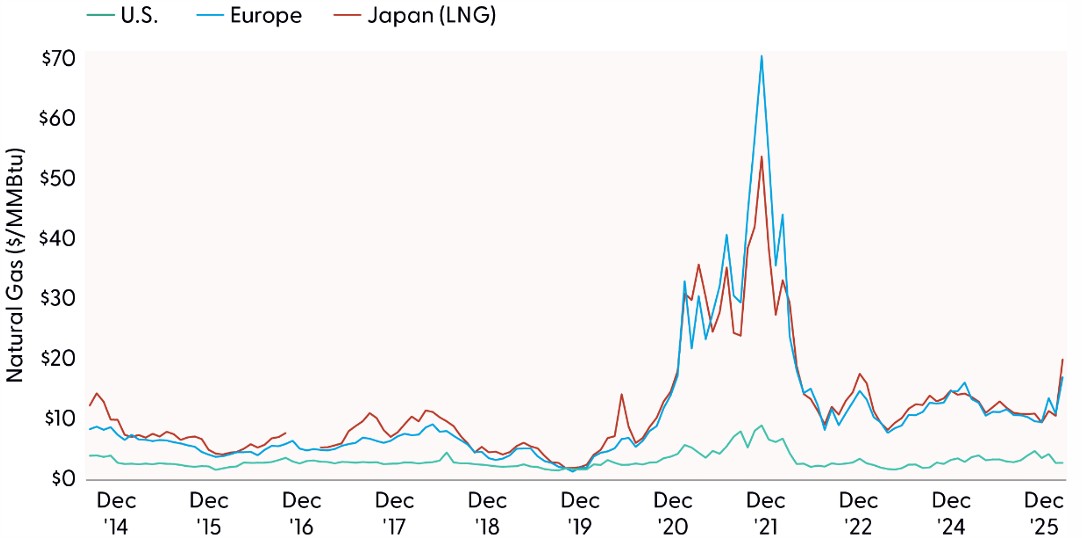
Source: LPL Research, Bloomberg 04/20/26
Disclosures: Past performance is no guarantee of future results.
Conclusion
Upon weighing the evidence, a strong argument can be made that an American manufacturing renaissance is underway, though we wouldn’t think of it as a wholesale reversal of globalization. The strongest evidence comes from rising domestic manufacturing construction, sustained capacity expansion, and policy frameworks that continue to encourage onshoring and investment in critical industries. Supply-chain resilience, industrial policy, and energy competitiveness together form a credible foundation for this shift, even if the benefits accrue unevenly across companies and are unlikely to translate into a proportional surge in manufacturing employment. For investors, the theme is compelling, but success may depend on implementation. Most importantly, successfully building exposure in portfolios will require distinguishing between companies with global industrial exposure and those most directly levered to domestic manufacturing, infrastructure, and power-related investment.
Asset Allocation Insights
Investors seeking focused exposure to the domestic manufacturing capital expenditures (capex) cycle should look toward selected individual companies in the industrials and materials sectors with high domestic revenue concentration and exposure to U.S. manufacturing, power, and grid investment or SMID-cap industrials and materials sector indexes/ETFs for the cleanest thematic exposure. The LPL Research Strategic and Tactical Asset Allocation Committee (STAAC) maintains a positive outlook on the industrials sector.
LPL’s Strategic Tactical Asset Allocation Committee (STAAC) recently moved portfolios to a modest overweight in equities and an underweight in fixed income. This shift builds on positioning decisions implemented ahead of the recent rise in volatility. In our view, increased market uncertainty has improved the forward-looking risk-reward for incremental equity exposure, allowing us to act within our established tactical framework while maintaining prudent risk controls.
Within Growth with Income (GWI) portfolios — our closest proxy to a traditional 60/40 allocation — this adjustment reflects two related changes: neutralizing the underweight to U.S. small cap value and reducing exposure to MBS to fund that move. From a portfolio construction standpoint, this lifts equity exposure slightly above benchmark while keeping overall risk well within the intended tactical range. This reflects improved expected equity returns following market weakness, alongside a more cautious outlook for select areas of core fixed income. Within equity sectors, the STAAC holds a positive view on the industrials and technology sectors.
Overall, our tactical views emphasize a modest equity overweight led by large-cap growth, a continued focus on quality, caution in rate-sensitive fixed income sectors, and an ongoing allocation to diversifying strategies and alternatives funded from cash.
Important Disclosures
This material is for general information only and is not intended to provide specific advice or recommendations for any individual. There is no assurance that the views or strategies discussed are suitable for all investors or will yield positive outcomes. Investing involves risks including possible loss of principal. Any economic forecasts set forth may not develop as predicted and are subject to change.
References to markets, asset classes, and sectors are generally regarding the corresponding market index. Indexes are unmanaged statistical composites and cannot be invested into directly. Index performance is not indicative of the performance of any investment and do not reflect fees, expenses, or sales charges. All performance referenced is historical and is no guarantee of future results.
Any company names noted herein are for educational purposes only and not an indication of trading intent or a solicitation of their products or services. LPL Financial doesn’t provide research on individual equities.
All information is believed to be from reliable sources; however, LPL Financial makes no representation as to its completeness or accuracy.
All investing involves risk, including possible loss of principal.
US Treasuries may be considered “safe haven” investments but do carry some degree of risk including interest rate, credit, and market risk. Bonds are subject to market and interest rate risk if sold prior to maturity. Bond values will decline as interest rates rise and bonds are subject to availability and change in price.
All index data from FactSet or Bloomberg.
This research material has been prepared by LPL Financial LLC.
Not Insured by FDIC/NCUA or Any Other Government Agency | Not Bank/Credit Union Guaranteed | Not Bank/Credit Union Deposits or Obligations | May Lose Value
For public use.
Member FINRA/SIPC.
RES-0006894-0326 Tracking #1098126 | #1098128 (Exp. 04/2027)