Energy Shock Expected to Hit Prices Harder Than the Economy
Headlines surrounding the Middle East have dominated investor attention since late February. While uncertainty remains elevated, diplomatic negotiations have supported equities, even as fixed income and commodity markets continue to reflect potential risks.
Economic Resilience Amid Headwinds: Recent economic data suggest the U.S. economy muddles on, though supply chain disruptions, higher shipping costs, and elevated energy prices are current headwinds. In our view, however, these pressures pose a greater risk to inflation than to economic growth.
Implications for Businesses and Consumers: Below, we outline the implications for businesses and consumers.
Another 0.2 and 0.3 Percentage Point Hit to Growth
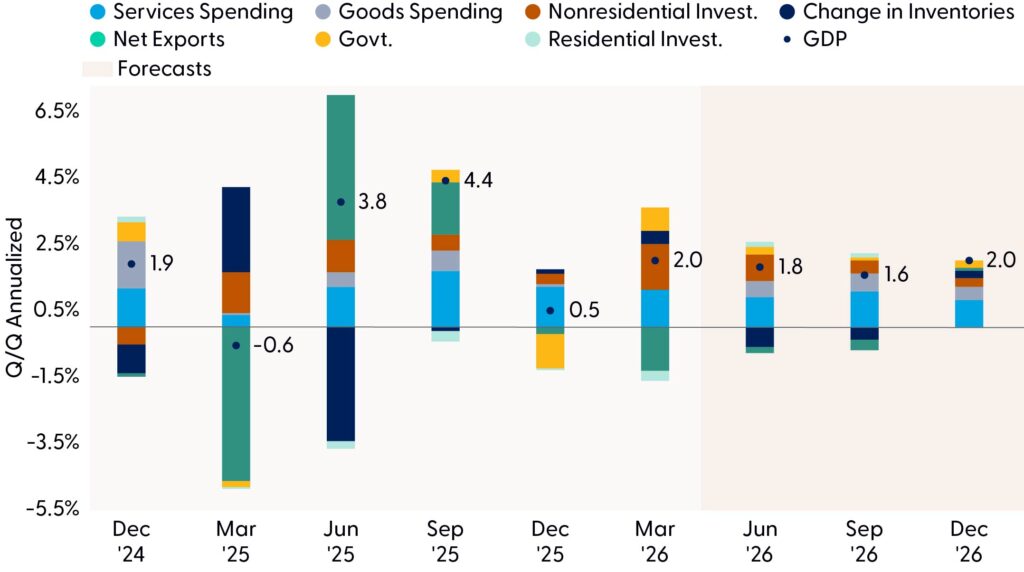
The Middle East war is expected to exert a modest but meaningful drag on near-term growth through renewed supply chain disruptions, higher shipping costs, and increased uncertainty around energy and trade flows. While the shock does not appear large enough to derail expansion, it will likely weigh on activity at the margin, particularly in trade-sensitive sectors and industries reliant on timely delivery of intermediate goods like fertilizer and steel. Our forecast assumes these disruptions subtract 0.2 percentage points from second quarter real gross domestic product (GDP) growth, reflecting delayed shipments, higher input costs, and a cautious inventory response from firms. Consult the Economic Navigator (May edition) for more context.
The impact is expected to intensify slightly in the third quarter, with supply chain friction subtracting 0.3 percentage points from growth as disruptions ripple more broadly through production schedules and business planning. The key macro implication is not a collapse in demand, but rather a temporary supply-side restraint that limits the economy’s ability to convert resilient final demand into output. If geopolitical tensions persist or energy markets become more volatile, downside risks could build; however, under our baseline expectations, the growth hit remains manageable and should fade as trade adjusts with the economy likely skirting recession (as highlighted in the “Lagged Effects from Middle East Crisis Expected to Cut Q2 Growth By 0.2 Percentage Points” chart).
Lagged Effects from Middle East Crisis Expected to Cut Q2 Growth by 0.2 Percentage Points
Disclosures: Forecasts may not materialize as predicted and are subject to change as additional data is published.
Business Investment Added 1.39 Percentage Points to the 2% Headline Growth
Non-residential fixed investment was a key support to first quarter growth, helping offset softer contributions from other parts of the economy and contributing roughly 1.4 points to headline growth. The strength largely reflected solid business spending on equipment, intellectual property products, and structures, suggesting firms remained willing to invest despite elevated financing costs and policy uncertainty. This matters because non-residential investment feeds directly into the real economy. When businesses increase capital outlays, it raises current demand while also expanding future productive capacity. In the first quarter, that contribution likely signaled an economy still benefiting from corporate investment tied to technology adoption, AI infrastructure, automation, reshoring, and productivity-enhancing software. In other words, even as household spending showed signs of cooling, business capital expenditures (capex) provided an important growth buffer and helped broaden expansion beyond the consumer.
In sum, business investment in tech equipment continues to boost growth. This category alone contributed 0.83 percentage points, close to the near-term record for last year. This category has more room to grow if the late 90s are any guide.
Loan Demand Should Stay Elevated as Savings Rate Stays Below 4% in 2026
The savings rate was 3.6% in March 2026, well below the roughly 6.5% pre-COVID-19 average and reflects a combination of higher living costs, continued discretionary spending, and the drawdown of excess savings that had supported consumption earlier in the cycle. For banks and credit unions, a lower savings rate can support loan growth, card balances, and fee income as consumers borrow more, but it also means thinner household liquidity buffers, greater sensitivity to job losses or rate shocks, and potentially higher delinquencies if the labor market weakens. New York Fed data show household debt at $18.8 trillion in Q1 2026, credit card balances at $1.25 trillion, and aggregate delinquencies broadly steady at 4.8%, but the key risk is that a low savings cushion leaves less room for error — especially for households already using credit to bridge the gap between income growth and cost pressures.
Households Are Storing Up Less and Less
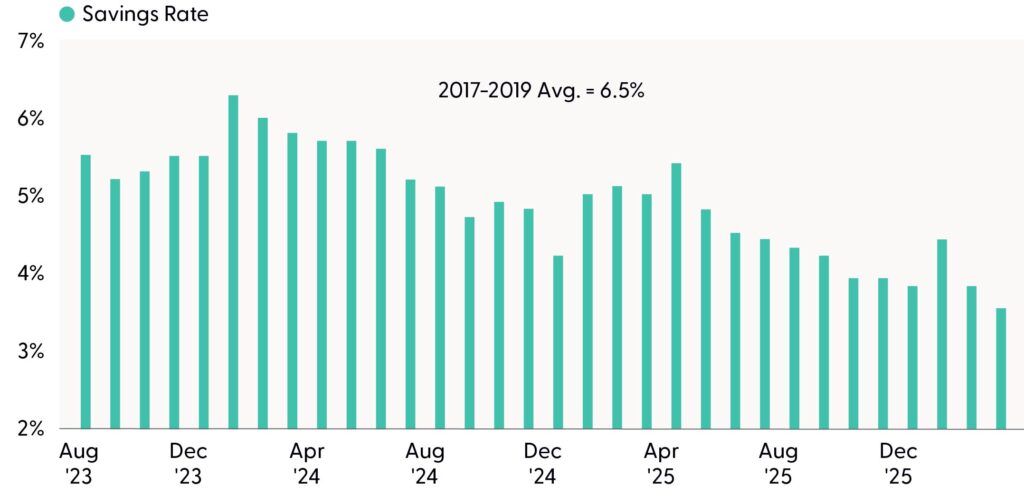
Source: LPL Research, Bureau of Economic Analysis, 05/13/26
Consumer credit demand remains solid because households are still spending, but the story is increasingly bifurcated. On one side, higher-income consumers are continuing to fuel retail activity through services, travel, restaurants, premium goods, and online spending. On the other, lower- and middle-income households are relying more on credit to manage elevated prices and cash-flow pressure. That mix helps explain why retail sales have stayed resilient. March retail and food services sales were up 1.7% month-over-month and 4.5% year over year. Meanwhile, revolving consumer credit rose to roughly $1.34 trillion in March 2026, with credit card rates still elevated near 21%, so the growth in credit demand is partly a sign of confidence and partly a sign of necessity.
A few metrics that often give leading indicators of stress are the 30-day and 90-day credit card delinquencies, which are currently sitting below pre-COVID-19 levels.
Middle East War Could Add Full One Percentage Point to Inflation
The April Consumer Price Index (CPI) report underscores that inflation risks are no longer narrowly concentrated in one category, even if the initial impulse remains energy led. Headline CPI rose 0.6% in April and 3.8% over the past year, while core CPI advanced 0.4% on the month and 2.8% year over year, signaling that the disinflationary trend has lost momentum. Energy was the dominant driver, with the energy index up 3.8% in April and accounting for more than 40% of the monthly headline increase, while gasoline rose 5.4% on the month and 28.4% from a year earlier. But the details also point to broader price pressures. Shelter increased 0.6%; food rose 0.5%; food at home climbed 0.7%; airline fares moved higher; and categories such as apparel and household furnishings also firmed. In other words, the April inflation shock is best understood as an energy-driven price impulse that is beginning to seep into transportation, food distribution, travel, and some goods categories.
Medical Care and Transportation Services Are Most Sticky
Source: LPL Research, Bureau of Labor Statistics, 05/13/26
Disclosures: Forecasts may not materialize as predicted and are subject to change as additional data is published
The key risk is that the Middle East conflict turns what might have been a temporary energy shock into a more persistent inflation event. If the conflict lingers through the summer, keeping oil prices elevated, disrupting shipping routes, and raising fuel, freight, and input costs, it could plausibly add a full percentage point to inflation this year through both direct gasoline effects and second-round pass-through into airfares, food, logistics, and imported goods. That would leave households facing a renewed cost of living squeeze just as real wage gains are being pressured, and it would complicate the Fed’s task by keeping headline inflation elevated while core inflation remains sticky. Under that scenario, the economy could face a more uncomfortable mix: softer real purchasing power, weaker consumer confidence, tighter financial conditions for longer, and a reduced likelihood of near-term rate cuts.
April Saw a Rebound in Wholesale Inflation
Inflation pressures resurfaced in April, reinforced by last Wednesday’s Producer Price Index (PPI) report. Headline producer inflation accelerated to 6% year over year — the highest reading since 2022 — driven largely by rising services costs. Services prices climbed 1.2% from March, led by a 5% jump in transportation and warehousing costs as higher energy prices boosted fuel-related margins. Core goods prices excluding food and energy also increased. One closely watched measure — processed goods for intermediate demand — rose more than 2.5% for a second straight month, signaling persistent cost pressures early in the production pipeline. While components feeding into the Fed’s preferred inflation gauge were mixed, the hotter-than-expected report reinforced expectations that the Fed will keep interest rates on hold amid sticky inflation and a still-resilient labor market.
Tariffs Likely Increased Core PCE by 0.8 Percentage Point
According to research from the Fed, full tariff pass-through is completed within 5 to 9 months.1 Therefore, as of February, the impact is fully realized with an increase of 0.8 percentage points to inflation as measured by personal consumption expenditures (PCE). Tariffs are likely to represent more of a one-time step-up in the price level than a persistent source of accelerating inflation. While tariff-sensitive categories, such as apparel and household furnishings, rebounded in the latest CPI report, the broader tariff impulse appears increasingly front-loaded, suggesting we are likely past the worst of tariff-induced inflation as firms have adjusted sourcing, inventories, and pricing strategies. As a result, the inflation outlook for the remainder of the year will likely be less about tariffs and more about the evolving Middle East conflict. If the Iran conflict lingers through the summer, sustained pressure on oil, gasoline, jet fuel, shipping, and broader logistics costs could become the dominant upside risk, pushing headline inflation higher and slowing the disinflation process even if tariff effects fade. In short, tariffs may have lifted the inflation floor, but geopolitics now represent the more material risk.
The Bottom Line
The outlook is shaped by resilient demand but rising supply-side risks. The Middle East war is expected to subtract 0.2 percentage points from Q2 GDP and 0.3 points from Q3 GDP through supply chain disruptions, higher shipping costs, and energy uncertainty. However, recession risk remains contained as business investment provides an important offset, with non-residential fixed investment contributing roughly 1.4 percentage points to first quarter growth, supported by equipment, technology, AI infrastructure, automation, and reshoring. If the 1990s are any guide, this area of capex could support growth for several more quarters.
Inflation and household balance sheets are the main vulnerabilities. A low savings rate is supporting credit demand but leaving consumers with thinner financial buffers, while spending remains bifurcated between resilient higher-income households and more credit-reliant lower- and middle-income consumers. Tariff effects appear largely front-loaded, but the Middle East conflict now represents a bigger inflation risk: if it persists through the summer, higher energy, freight, and logistics costs could add as much as one percentage point to inflation this year. Meanwhile, AI is likely to reshape rather than simply eliminate jobs, with efficiency gains potentially increasing demand for AI-enabled work while raising the premium on adaptability and human judgment.
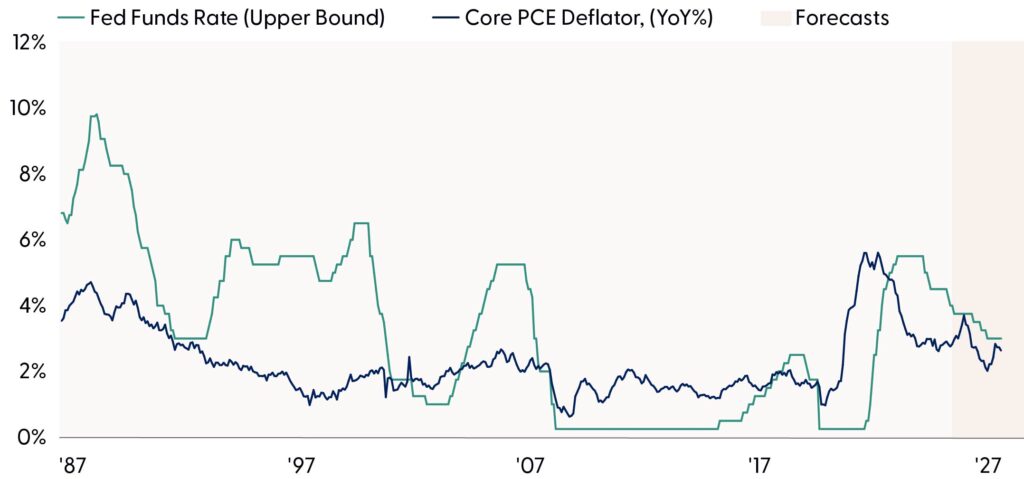
Structural changes — an aging population, a productive labor force, and easing services inflation — give the Fed room to cut rates this year, although the temporary spike in energy prices may delay the continuation of the rate easing cycle.
Asset Allocation Insights
LPL’s Strategic and Tactical Asset Allocation Committee (STAAC) recently moved its equities recommendation to a tactical overweight and fixed income to underweight to reflect the improving macroeconomic backdrop.
Within balanced portfolios, this adjustment reflects two related changes: neutralizing the underweight to U.S. small cap value and reducing exposure to mortgage-backed securities (MBS) to fund that move. From a portfolio construction standpoint, this lifts equity exposure slightly above benchmarks while keeping overall risk well within the intended tactical range. This reflects improved expected equity returns following market weakness, alongside a more cautious outlook for select areas of core fixed income. While MBS have delivered strong relative performance over recent years, tighter spreads and rising prepayment risks suggest more limited forward return potential.
Overall, our tactical views emphasize a modest equity overweight led by large cap growth, a continued focus on quality bond sectors, caution in rate‑sensitive fixed income sectors, and an ongoing allocation to diversifying strategies and alternatives.
Important Disclosures
This material is for general information only and is not intended to provide specific advice or recommendations for any individual. There is no assurance that the views or strategies discussed are suitable for all investors or will yield positive outcomes. Investing involves risks including possible loss of principal. Any economic forecasts set forth may not develop as predicted and are subject to change.
References to markets, asset classes, and sectors are generally regarding the corresponding market index. Indexes are unmanaged statistical composites and cannot be invested into directly. Index performance is not indicative of the performance of any investment and do not reflect fees, expenses, or sales charges. All performance referenced is historical and is no guarantee of future results.
Any company names noted herein are for educational purposes only and not an indication of trading intent or a solicitation of their products or services. LPL Financial doesn’t provide research on individual equities.
All information is believed to be from reliable sources; however, LPL Financial makes no representation as to its completeness or accuracy.
All investing involves risk, including possible loss of principal.
US Treasuries may be considered “safe haven” investments but do carry some degree of risk including interest rate, credit, and market risk. Bonds are subject to market and interest rate risk if sold prior to maturity. Bond values will decline as interest rates rise and bonds are subject to availability and change in price.
The Standard & Poor’s 500 Index (S&P500) is a capitalization-weighted index of 500 stocks designed to measure performance of the broad domestic economy through changes in the aggregate market value of 500 stocks representing all major industries.
The PE ratio (price-to-earnings ratio) is a measure of the price paid for a share relative to the annual net income or profit earned by the firm per share. It is a financial ratio used for valuation: a higher PE ratio means that investors are paying more for each unit of net income, so the stock is more expensive compared to one with lower PE ratio.
Earnings per share (EPS) is the portion of a company’s profit allocated to each outstanding share of common stock. EPS serves as an indicator of a company’s profitability. Earnings per share is generally considered to be the single most important variable in determining a share’s price. It is also a major component used to calculate the price-to-earnings valuation ratio.
All index data from FactSet or Bloomberg. All index data from FactSet or Bloomberg.
This research material has been prepared by LPL Financial LLC.
Not Insured by FDIC/NCUA or Any Other Government Agency | Not Bank/Credit Union Guaranteed | Not Bank/Credit Union Deposits or Obligations| May Lose Value
For public use.
Member FINRA/SIPC.
RES-0007019-0426 Tracking #1105277 | #1105280 (Exp. 05/27)